Debugging
Debugging tools
Devs with AWE have some interesting tools to make their job easy
Server debug
To debug the server-side of a web application project, we usually work with the IDE (Netbeans, Eclipse, IntelliJ, Visual Studio Code) embedded debugger. This guide will show you how to debug in Eclipse
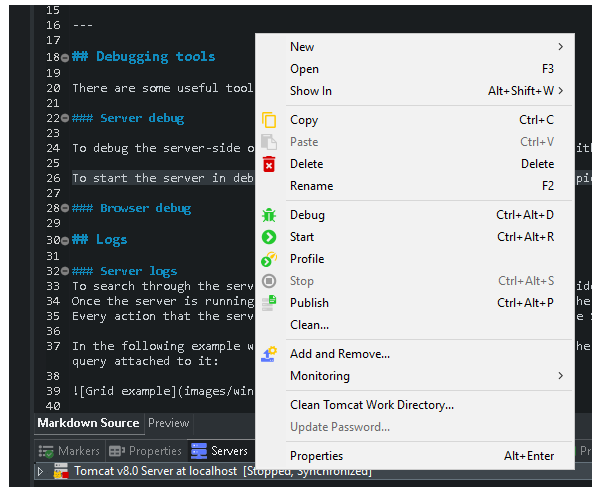
To start the server in debug mode we can right click on the server, and pick the debug option.
We can add a breakpoint anywhere in the code by right clicking at the side, and choosing toggle/add breakpoint.
For more information about debugging see eclipse documentation:
- IntelliJ
- Eclipse
- Netbeans
- Visual Studio Code
Browser debug
We can see the information flow between the server and the client by pressing F12 key and entering the network tab. There are a few useful options there but we will focus on the WS (WebSocket)
In the following example the interactions between the server and the client are displayed, and we can search through the JSON structure to see all the information and variables.
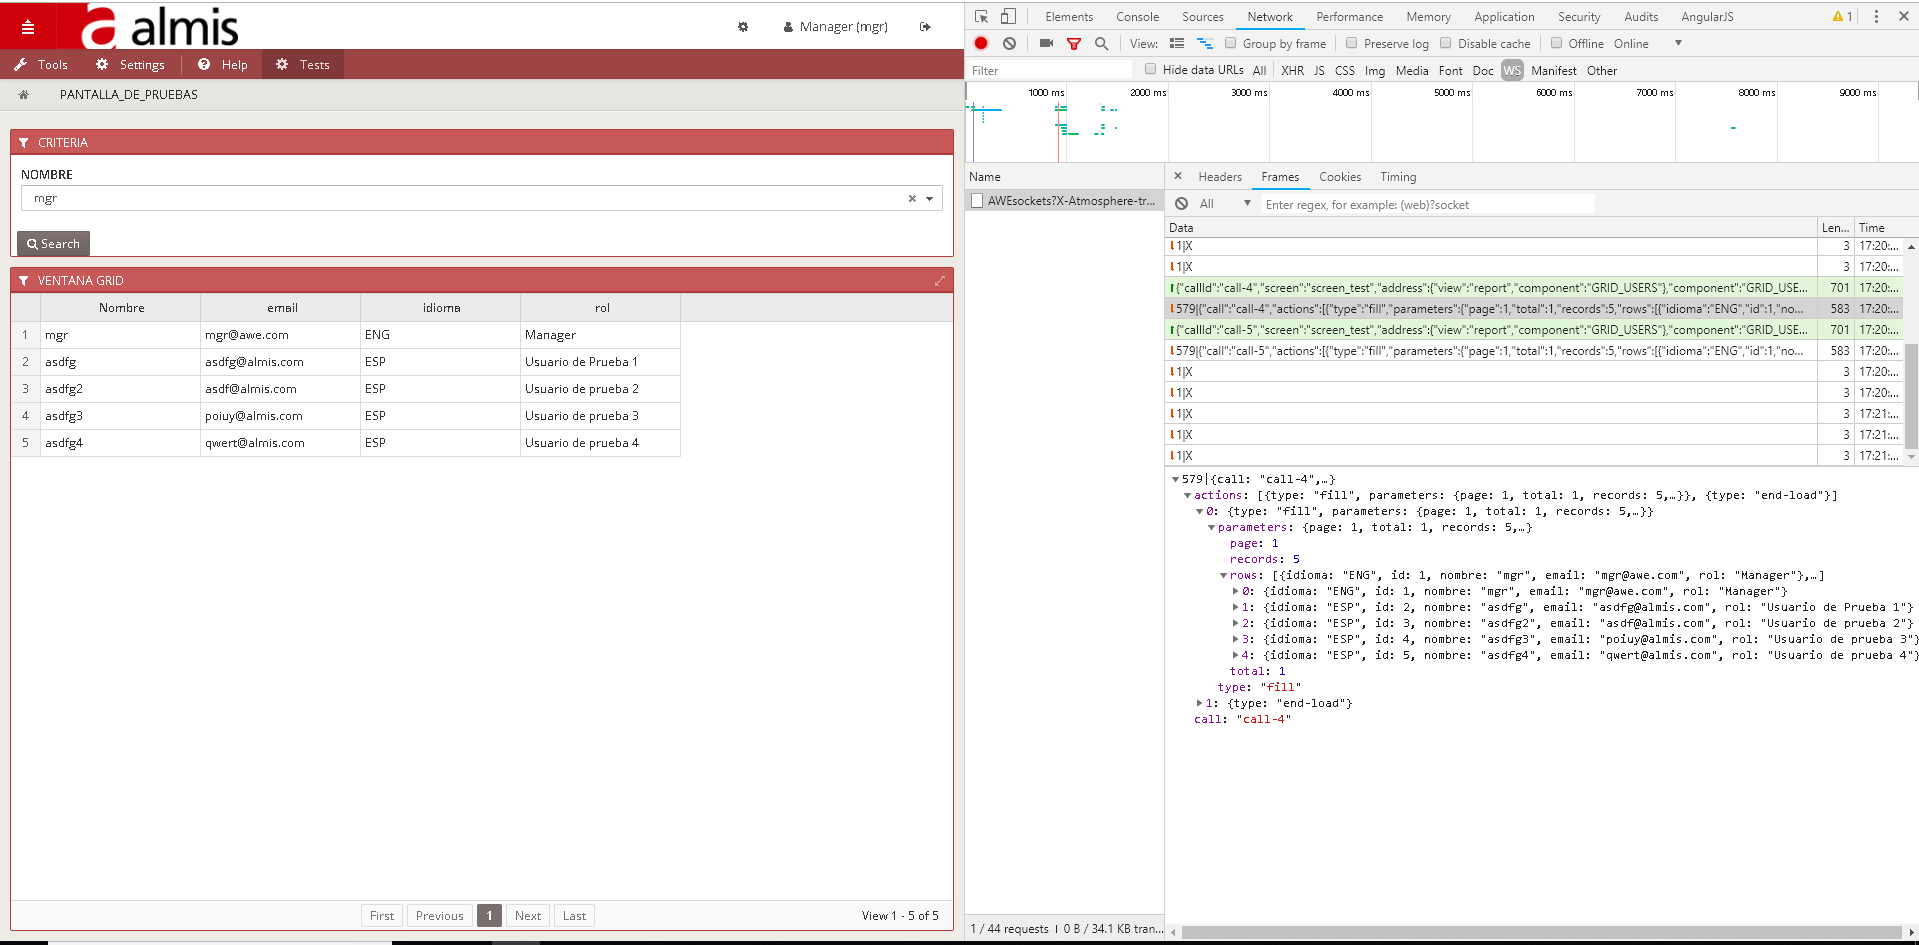
We can see the action that the server sent to the client, in this case is a type fill action with the parameters attached to it
Angular JS Batarang
Angular JS Batarang is an extension for browsers that adds tools for debugging and profiling AngularJS applications.
Angular JS Batarang Chrome extension
This extension allows us to see the angular scope info. The scope is the binding part between the HTML (view) and the JavaScript (controller). Once the extension is installed, by pressing F12 and accessing the elements tab we can see the new $scope option.
The information displayed there contains all JavaScript methods and parameters, in JSON format.
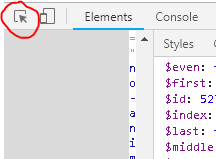
We can select a window element by clicking the inspect option to see all the scope information regarding only that element. In chrome the option is the following:
In this example, we select a grid containing users information. Between all the options we can see the controller info, like the grid attributes, variable types...
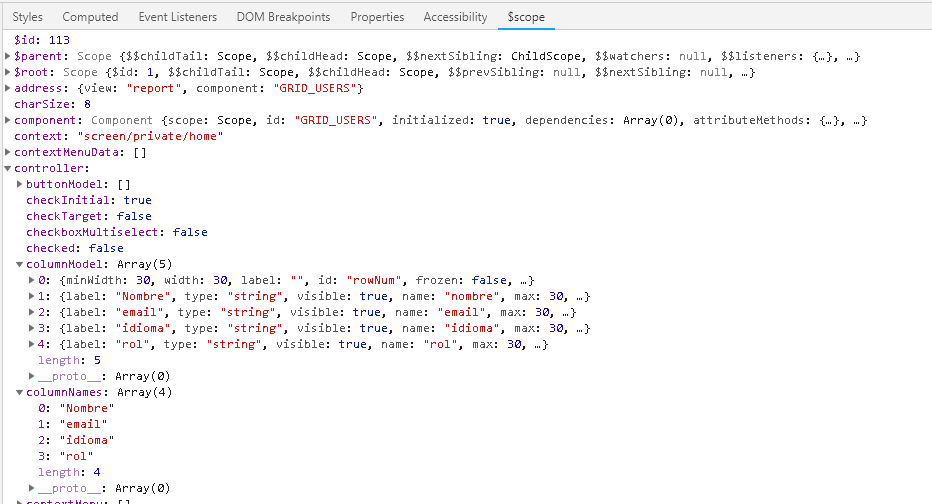
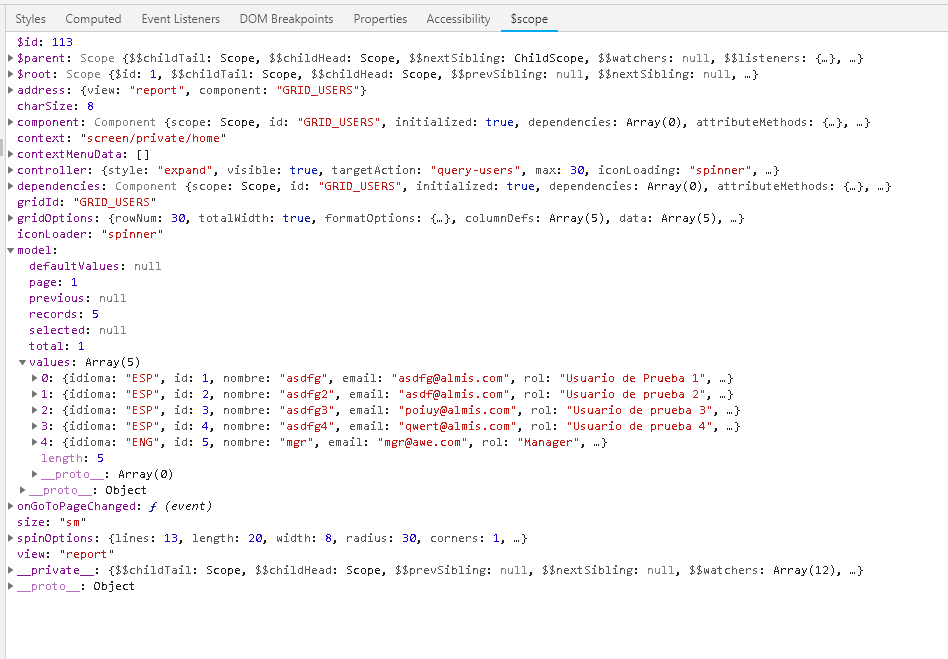
It is also interesting to see the model option, as it contains the data itself.
Logs
Server logs
To search through the server logs we can use the tools Eclipse provides. Once the server is running, the logs will appear in the Console tab. Every action that the server executes will be displayed here, such as the SQL queries.
In the following example we have a grid that displays information from the users table, and a criteria that filters that grid by executing a SQL query attached to it:
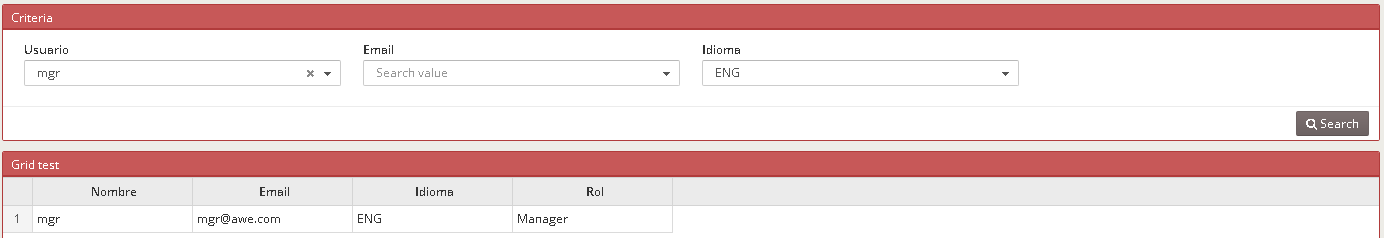
Once we hit the search button, the server will execute the SQL query, and the console log will display it:
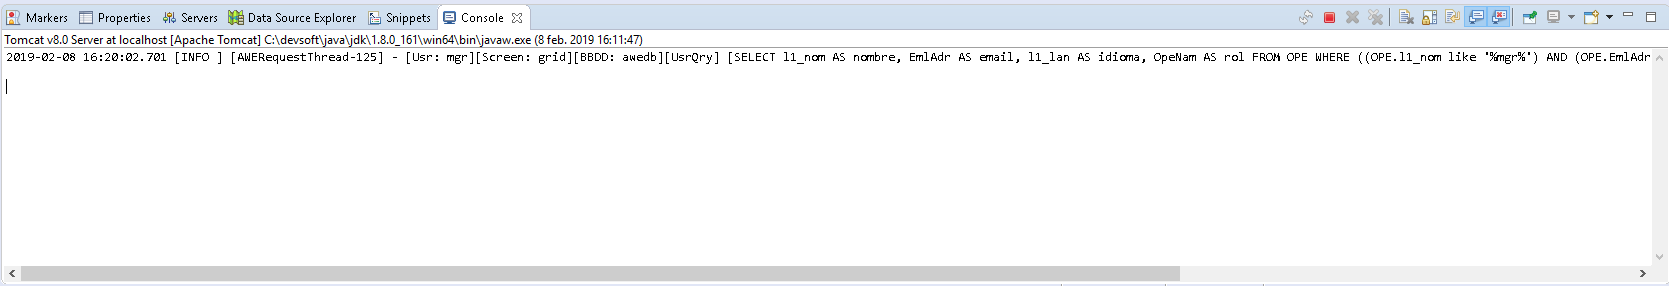
In this case we can see the date and time that the action was executed as well as the user, the screen, the query ID, and the full SQL query.
Browser console
To search through the browser console, press the F12 key, and click on the Console tab.
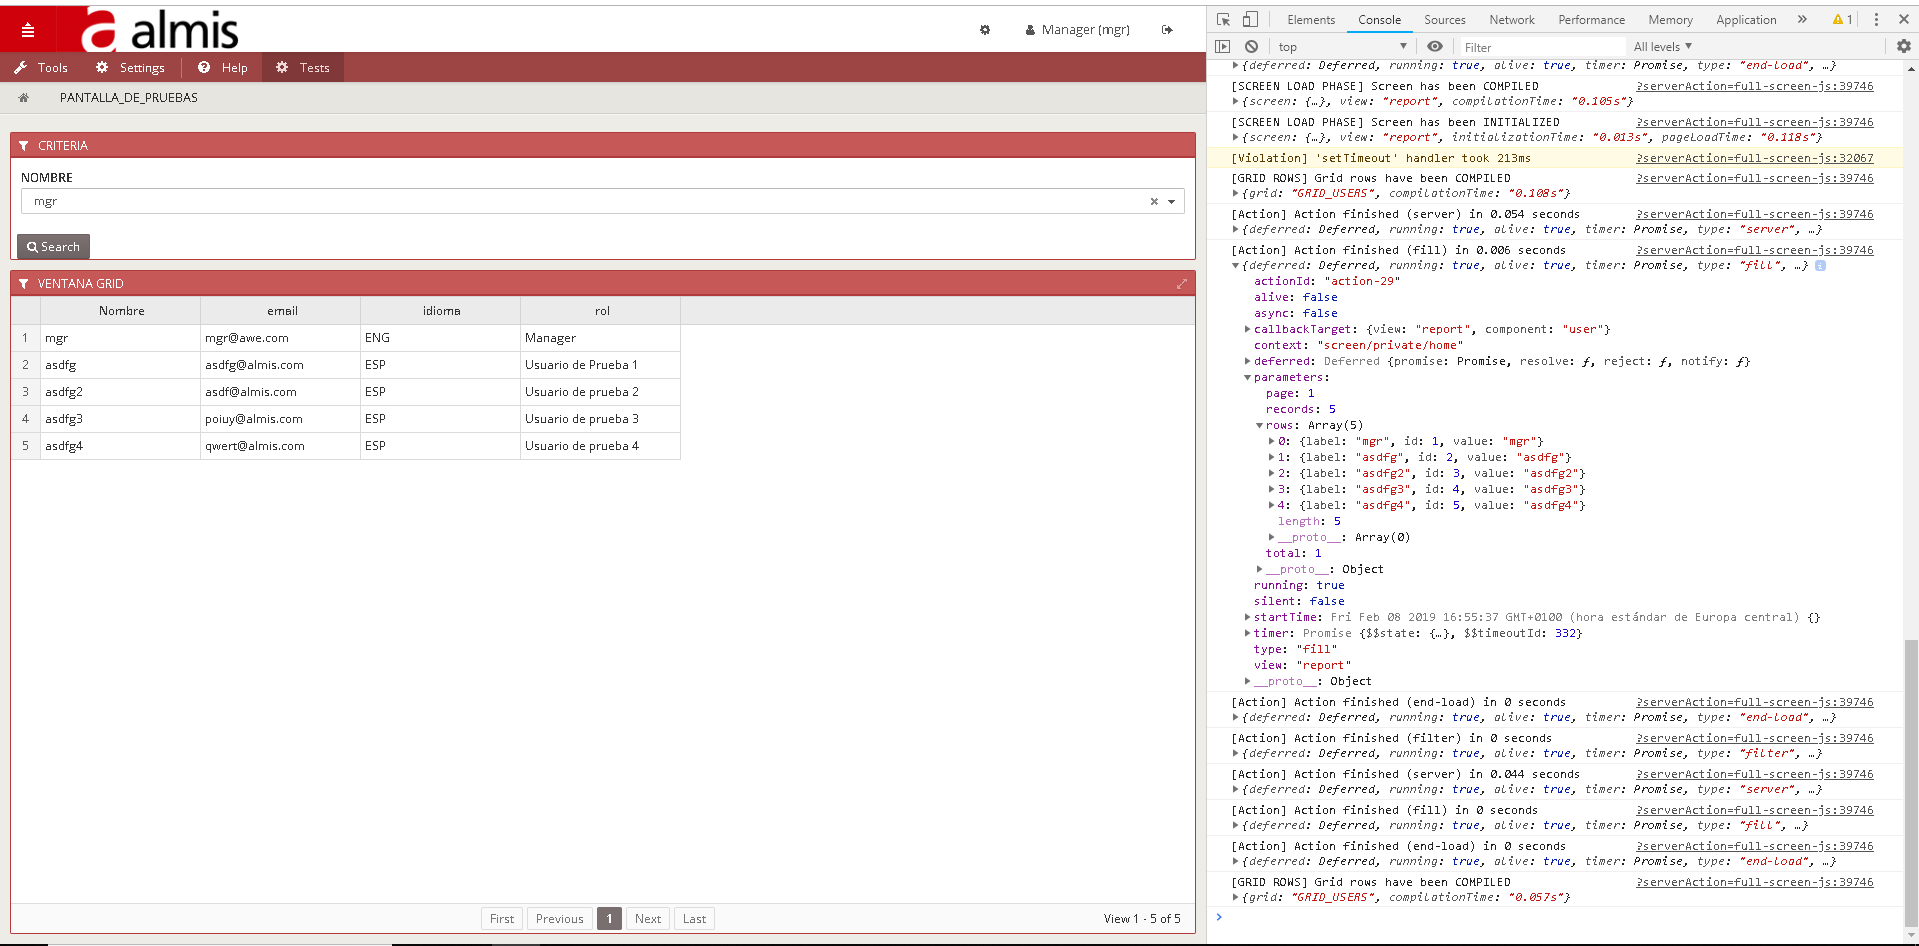
Actions
In this tab we can look at actions taking place at the client side, along with the elapsed times they take and the parameters sent to the server. In this example there is a fill action, used to fill a grid with query data.
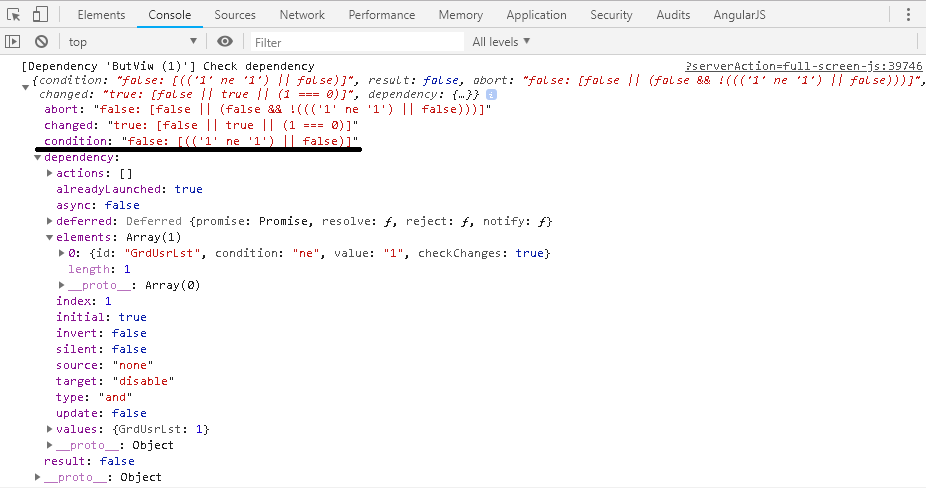
Dependencies
In the following example we have a grid, and a view button with a dependency attached to it. The dependency checks if the number of selected rows is not equal to 1. If the condition is true, the view button is hidden. Otherwise the button is activated.
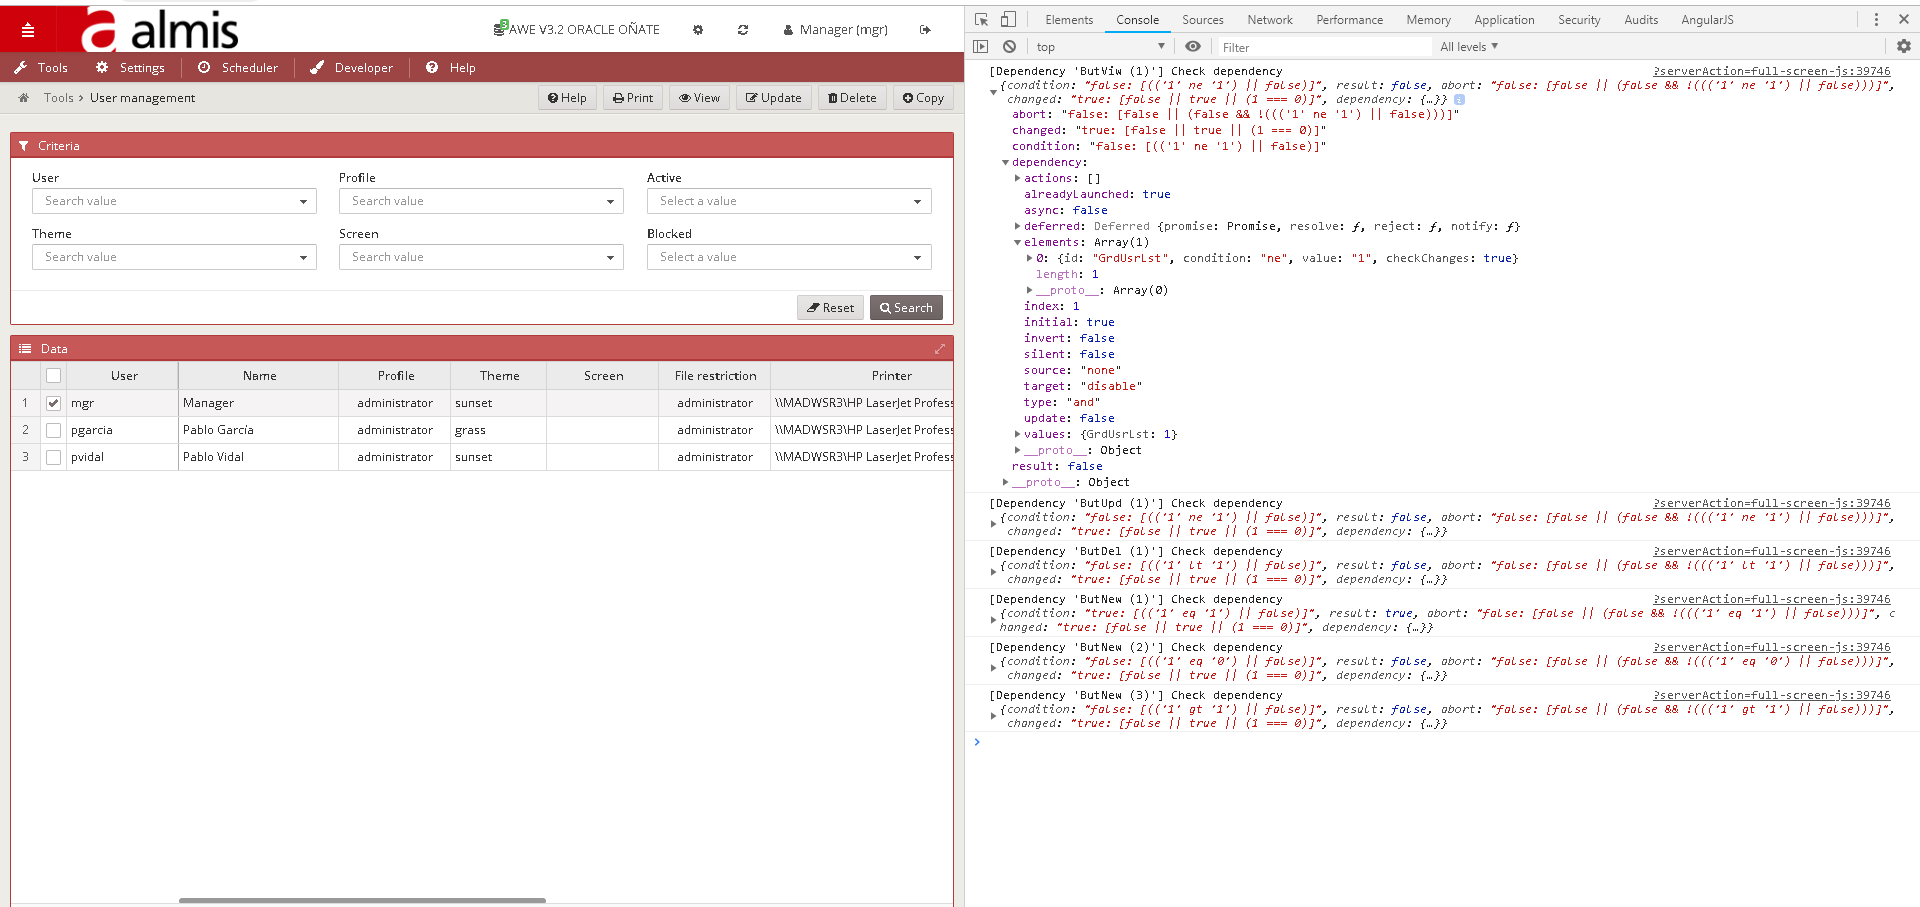
As only one row is selected, the condition result is false, therefore, the button is not hidden.