Print engine
AWE includes a generic printing engine that allows generating the content of a screen in PDF, Excel and DOC formats.
Printing a screen
To enable printing in a screen, include the generic AWE printing dialog:
<include target-screen="PrnOpt" target-source="center" />
Then add a button that opens the included dialog:

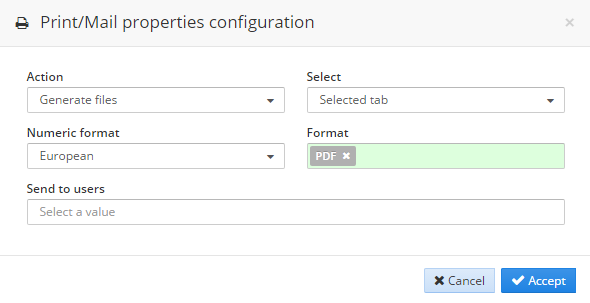
Once these two steps are completed, the user can open the printing dialog and choose the output format and options:
Configure title
By default, the title of a printed report is generated with the pattern:
report title : report subtitle
The values used for the title and subtitle are taken from the labels defined in the screen, such as the screen label, tabcontainer label, window label or grid label.
The following example shows a screen before printing:
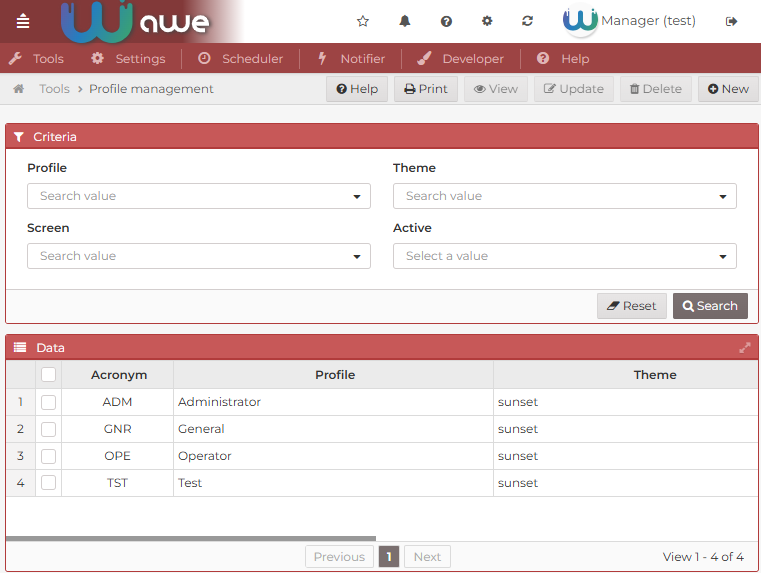
If no additional configuration is applied, AWE uses the existing screen labels to build the printed title.
The printed result for the previous screen is the following:
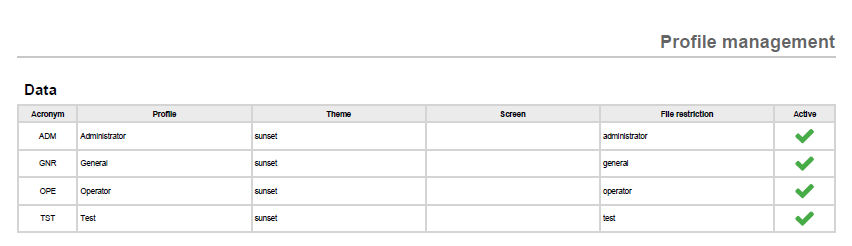
You can customize this behavior in the following ways:
- Default behavior: if you do not add any additional configuration, AWE uses the labels already defined in the screen.
- Custom subtitle: define the
labelattribute in the correspondingtabcontainerand use a locale entry if needed. - Remove the main title: set the screen
labelto an empty value if you want the printed report to show only the subtitle.
For example, after defining a custom subtitle in the tabcontainer label, the screen configuration looks like this:
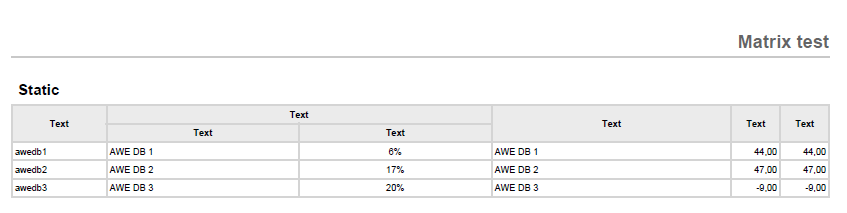
In short, the printed title is controlled by the same labels used in the screen structure, so title customization is done through normal screen configuration.
Configure printing data
Since AWE 3.2, the printing engine uses the data that is currently available in the client and sends it to the printing engine.
This is important when a grid uses server-side pagination (load-all="false"). In that case, the client only has the rows currently loaded in the page, so the printed document will only include that data.
If you need to print the complete result set, the simplest option is to use local pagination:
load-all="true"
This makes all rows available in the client, so the printing engine can include the full dataset.
This approach can cause serious performance problems if the query returns a large number of rows.
If you need to keep server-side pagination and still print the full dataset, you should implement a project-specific printing flow that reloads the required data before generating the document. That scenario depends on the application and is outside the scope of this generic guide.
Choose which grid columns are printed
Grid columns are printed according to their printable attribute:
- Not set: printed in every format, but only while the column is visible on screen.
true: printed in every format, even when the column ishidden="true".excel: printed only in spreadsheet outputs (XLSX and CSV), even when hidden.false: never printed.
This is the recommended way to print a raw value when the column shown on screen carries styling markup:
<column label="AMOUNT" name="Amount" charlength="20" printable="false"/>
<column label="AMOUNT" name="AmountRaw" charlength="20" hidden="true" type="float" printable="true"/>
See printing columns for the full rules.
What a printed grid shows
A printed grid reproduces what the grid shows on screen. The column attributes that decide it are read from the screen definition on the server, so the report follows the XML of the screen in both client engines. PDF (and the other document formats: DOCX, RTF, HTML, TEXT) draw them; XLSX, XLS, ODS and CSV write them as text.
| Feature (attribute) | PDF and documents | XLSX and CSV |
|---|---|---|
Secondary line (secondary-field) | Under the value, smaller and muted, in the same cell, when the column is text (no type or type="string"). On a numeric, date or chip column it goes to its own column after the main one | A column after the main one only with export-secondary="true" (titled with secondary-label) |
Status (status-field) | A chip with the text of the cell, coloured with the tone of the row (success, warning, danger, info; any other tone is neutral) | The text of the cell |
Chips (chips="true", chip-separator) | One chip per item (all of them: max-chips only limits the screen), neutral, or with the tone of status-field when the column also has one | The items joined with a comma and a space |
Progress (component="progress", bar-min, bar-max) | A bar filled with the value inside its scale (0 to 100 by default) and the text of the cell. The second value and the stacked segments of the bar options are not drawn | The text of the cell |
Sparkline (component="sparkline") | The series as a line, bars or an area (sparkline-type), with sparkline-color and sparkline-negative-color. Last point and min/max marks are not drawn | The numbers of the series |
Formatted text (component="formatted-text") | Plain text: tags removed, entities decoded, line breaks as spaces. Never markup | Plain text |
| Grouping | Group rows, subtotals and total, see below | The same rows, styled, without outline levels |
Row detail (<row-detail print="true">) | Under each row, see below | One cell across the width of the grid under each row |
Notes:
- The colours of a sparkline are
#RRGGBB(or#RGB) hexes or the name of a palette of the design system (green,red,sky...), which prints its500shade. Any other value (for example a CSS variable) is ignored and ADE uses its default colour; a bad colour never fails the print. The status and group colours are fixed print values taken from the AWE 5 design tokens, as a report has no CSS variables. - The secondary field and the status field travel with the print data: both engines send them even when they are not columns of the grid, as long as a printed column uses them.
- A grid without these attributes prints exactly as before.
Grouped grids
The grid prints with the grouping the user has chosen when printing: both engines send the columns that group the rows,
also none when the user chose No grouping, and the server uses the group-by of the grid only when the client sends
nothing. Grids that cannot group on screen (tree, editable, send-operations, move-rows or row-detail grids) do not
group in the report either.
- Each group has a group row,
GROUP1,GROUP2... by level (bold, on the surface colours of the design system, lighter for each level), with the value of the group and its number of rows, and the aggregates (sum,avg,max,min) of the columns withsummary-type. The label goes in the first printed column that is plain text (none when no printed column is text, so a number or date cell never gets it); an empty value is labelled (empty). - Its rows come next; when
group-subtotalsis notfalsea subtotal row closes each group of every level. - The grand total comes last when
show-totalsis on: the footer that the screen sends. - Every group is printed expanded. Groups go by their value, ascending: numbers first, then texts, the empty one last. The rows keep the order the client sends. The sort the user chose on screen is not applied to the order of the groups.
- A column that groups does not have to be printed. A column with
summary-typethat is the label column shows the label. - Group rows, subtotals and the total are styled by their row kind, without an extra column.
Row detail
A grid whose <row-detail> declares print="true" prints its detail under each row; without it, nothing changes. A
text template is rendered by the server for every row with the rules of the screen; a nested grid runs its query once per
printed row (limited by its max, 100 when it declares none) and prints its columns as a table. See
printing the detail for what it needs and the limits. A detail built with an
include is not printed. In XLSX the detail is a cell merged across the grid, and a nested table does not align with the
columns of the grid: the sheet gets extra columns and the nested header repeats under each row.