Grids
Try the grid and the tree grid with live controls in the component catalog: the real AWE components, sample data and the XML that produces them.
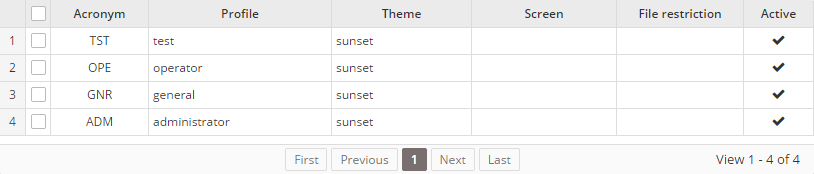
Grids are the main component in AWE to show data lists. It is defined by grid and columns:
- The grid is the container of the data list. It has the query to load and a set of attributes to define the behaviour of the grid.
- Each column contains the source of the data from the data list, the label of the column and other attributes to manage each column cell.
There is also a group-header tag which is used to show a second level header over a group of column headers.
XML skeleton
To define a grid or a treegrid in AWE you must follow the next structure:
<grid id="[grid-identifier]" ...>
  <column ... ></column>
  ...
  <group-header ...>
    <column ...></column>
    ...
  </group-header>
  ...
  <button ... > ... </button>
  ...
  <context-button ...> ... </context button>
  ...
  <row-detail> ... </row-detail>
  ...
  <search ... />
  <quick-filter ... />
</grid>
Grid structure
<grid id="[grid-id]" style="[grid-style]"
      multiselect="[grid-is-multiselect]" checkbox-multiselect="[checkbox-multiselectable]" editable="[grid-is-editable]" send-operations="[grid-is-multioperation]" initial-load="[initial-load]" server-action="[server-action]" target-action="[target-action]" max="[elements-per-page] pagination-disabled="[pagination-disabled]"">
...
</grid>
General attributes
| Attribute | Use | Type | Description | Values |
|---|---|---|---|---|
| id | Required | String | Grid identifier. For reference purposes | |
| label | Optional | String | Grid title (For printing only) | Note: You can use i18n files (locales) |
| style | Optional | String | Grid CSS classes | |
| initial-load | Optional | String | Server action call to load the grid data. It only supports query value | |
| server-action | Optional | String | Server action call | See server action list |
| target-action | Optional | String | Target to call on the server | |
| max | Optional | Integer | Maximum number of elements to retrieve per page | 0 shows every row in a single page, without paginator. Default: 30 |
| pagination-disabled | Optional | Boolean | Disabled the pagination element of grid | Note: Default value false |
| pager-values | Optional | String | Enable grid pager. Set the value list with the number of rows per page | Example: pager-value="5,25,50,100" |
| load-all | Optional | Boolean | Load all values of the grid and sort and paginate locally | Note: Default value is false |
| send-all | Optional | Boolean | Send all values of the grid to the server instead of selected ones. (Selected ones will be sent on .selected parameter) | Note: Default value is false |
| help | Optional | String | Help text for the grid | Note: You can use i18n files (locales) |
| help-image | Optional | String | Help image for the grid | This must be a image path |
| icon-loading | Optional | String | Set the loading icon | skeleton, skeleton-dim, spinner, square, circles, carpet, dots, folding, squarebar, circlebar, cubes, icon, custom, none. Default: the awe.application.component.grid-icon-loading property (skeleton). skeleton shows placeholder rows with the grid columns on the first load and on every reload; set another value to disable it on this grid. skeleton-dim shows them on the first load, and a reload while rows are shown keeps them, dimmed and not clickable (aria-busy="true"), instead of replacing them; with any other icon the grid keeps its icon on first load and reload |
| row-numbers | Optional | Boolean | Whether to show row numbers or not | Default value is true |
| row-height | Optional | Integer | Set the row height in pixels (the minimum when columns wrap). Without it, the AngularJS engine takes the row height of the density (one line of text and the vertical cell padding of the density) and updates it when the density changes | |
| validate-on-save | Optional | Boolean | Set false to avoid validate the selected row when clicking the save button | Default value is true |
| empty-icon | Optional | String | Icon of the empty state of the grid | Default value is inbox. Check icons |
| empty-title | Optional | String | Title of the empty state of the grid | Note: You can use i18n files (locales). Default: a translated "No records found" title |
| empty-text | Optional | String | Text of the empty state of the grid | Note: You can use i18n files (locales). Default: a translated explanation text |
| empty-action | Optional | String | Identifier of a button of the grid that is offered in the empty state | The empty state shows a button with the label and the icon of that button, which runs its actions |
| show-toolbar | Optional | Boolean | Shows the toolbar of the grid, with the Columns dialog and the Maximize button | Default value is true. Set false to opt out (the quick filters of the grid are still shown) |
| show-columns-button | Optional | Boolean | Shows the Columns button of the toolbar. When it is hidden, the column layout stored by the user is ignored (neither applied nor saved) | Default value is true. show-toolbar="false" hides it too |
| show-maximize-button | Optional | Boolean | Shows the Maximize button of the toolbar | Default value is true. show-toolbar="false" hides it too |
| toolbar-labels | Optional | String | Which end buttons of the toolbar show their label: true (all), false (none, only the icon with the label as tooltip) or a comma-separated list of group-by, saved-searches, columns and maximize. See labels of the toolbar buttons | Default: grid-toolbar-labels (false, icon only) |
| columns-panel | Optional | String | How the toolbar shows the Columns: a popover anchored to the Columns button, a modal dialog or a side panel anchored to the right edge | popover, dialog or side-panel. Default: grid-columns-panel (popover) |
| move-rows | Optional | Boolean | Adds a leading column with a grip to move the rows by dragging them. Not available in tree grids | Default value is false |
| saved-searches | Optional | Boolean | Shows the Saved searches menu in the toolbar: each user saves and applies the column filters, sort, quick filter and search of the grid | Default value is false |
Toolbar
Every grid shows a toolbar, in both the AngularJS and the React engines, with two buttons:
- Columns opens a popover anchored to the button that lists the columns of the grid. The user shows or hides each column and moves it up or down (with the arrows or by dragging its handle); the header shows how many columns are visible ("N of M visible").
- Maximize makes the grid fill the content area of the screen, like the maximize button of a window or a tab: the grid grows with an animation, the application header and menu stay visible and the rest of the screen fades out until the grid is restored.
The popover has no backdrop: the grid stays visible and every change is applied to it at once. Its footer has three actions:
| Action | Effect |
|---|---|
| Restore default | Goes back to the definition of the screen XML and removes the layout that the user saved |
| Cancel | Undoes the changes made since the Columns were opened (or since the last Restore default) and closes them |
| Save | Stores the current layout for the user and closes the Columns. While it saves, the button shows a spinner and Saving… and is disabled. When it cannot be saved they stay open |
The close button (x), Esc and a click outside close the popover and keep the changes; the focus goes back to the Columns button. There is no Show all action any more: check each hidden column instead.
The changes are kept for the next visits only when the user chooses Save. The saved layout belongs to the user,
so it follows them to other browsers and devices, and it is stored in the AweUsrGrdCnf table (one row per user, screen
and grid; created by a database migration). Restore default removes it. The user is always taken from the session. The
layout is applied when the screen is generated: the grid is sent with its original columnModel plus a columnLayout
(the order of the columns and the hidden ones), so the first render is already personalized.
Some rules keep a stored layout valid when the screen changes:
- Columns hidden in the XML (
hidden="true", for example keys) never appear in the dialog. - Button columns (
component="button") are actions, not data: they never appear in the dialog nor count in its counter, they always stay visible where the XML puts them, and the entries of a stored layout for them are ignored. - Column ids that no longer exist are ignored, and a column added to the XML appears visible at its XML position.
- A column can only be reordered within its own
group-header, and ungrouped columns among themselves; a column never leaves its group, even if the stored layout says otherwise. Groups are not reordered as blocks. - The group headers are computed from the visible columns of each group, so hiding any column of a group (also the first one) keeps the headers aligned, and a group without visible columns is not shown.
With columns-panel="dialog" the Columns open in a modal dialog, and with columns-panel="side-panel" in a panel
anchored to the right edge of the screen, both with the same content as the popover. They keep the keyboard focus
inside, close with Esc, their close button (x) or a click outside, and give the focus back to the Columns button.
The grids that do not set columns-panel use the application property
awe.application.component.grid-columns-panel
(popover by default), so an application can show the Columns of all its grids as a modal dialog or as a side panel.
<grid id="UserGrid" columns-panel="side-panel" server-action="data" target-action="UserList">
  <column label="USER" name="user" />
</grid>
Set show-toolbar="false" to opt a grid out of the toolbar; the grid then always uses the XML definition.
<grid id="UserGrid" show-toolbar="false" server-action="data" target-action="UserList">
  <column label="USER" name="user" />
</grid>
To keep the toolbar but hide one of its buttons, set show-columns-button="false" or show-maximize-button="false".
show-toolbar="false" stays the master switch and hides both. A grid without the Columns button always uses the XML
definition too: the layout the user stored for it is neither applied nor saved.
<grid id="UserGrid" show-columns-button="false" show-maximize-button="false" server-action="data" target-action="UserList">
  <column label="USER" name="user" />
</grid>
Labels of the toolbar buttons
The end buttons of the toolbar (Group by, Saved searches, Columns and Maximize) show only their icon by default,
in both engines. Their label stays as the tooltip (title) and the accessible name (aria-label) of the button. The
application property
awe.application.component.grid-toolbar-labels
(false by default) sets it for every grid; set it to true to show the labels again. The grid attribute
toolbar-labels overrides the property for one grid, and it can choose the buttons one by one:
| Value | End buttons |
|---|---|
true | All of them show their label |
false | All of them show only their icon |
| A comma-separated list | The listed ones show their label, the others only their icon |
The names of the list are group-by (Group by), saved-searches (Saved searches), columns (Columns) and
maximize (Maximize), in any order and with optional spaces after the commas. The schema rejects any other name and
the server ignores it with a warning in the log. The property stays true or false: it has no list.
<grid id="UserGrid" toolbar-labels="saved-searches" saved-searches="true" server-action="data" target-action="UserList">
  <column label="USER" name="user" />
</grid>
Excel and PDF exports and printing use the columns of the screen XML, not the layout of the user.
Search
A grid can show a search field at the start of its toolbar, before its quick filters: a
text box with a search icon that filters the grid as the user types, such as User, name, email or profile…. Declare a
<search> inside the grid. It works in both client engines.
<grid id="GrdUsrAdm" style="expand" initial-load="query" server-action="data" target-action="UsrLst">
  <search id="CrtUsrTxt" placeholder="SCREEN_TEXT_USER_SEARCH"/>
  <quick-filter id="CrtUsrSta" initial-load="query" target-action="UsrStaCnt" value=""/>
  <column label="PARAMETER_USER" name="Nom" />
  ...
</grid>
| Attribute | Use | Type | Description | Values |
|---|---|---|---|---|
| id | Required | String | Identifier of the search, and the name of the parameter that sends its text with the grid | |
| placeholder | Optional | String | Text shown in the empty field | Note: You can use i18n files (locales) |
| label | Optional | String | Accessible name of the field, read by screen readers. It is not shown | Note: You can use i18n files (locales). Default value is BUTTON_SEARCH |
| value | Optional | String | Text of the field when the screen is opened | Default: empty, the grid unfiltered |
Value. The search has no query of its own: it has no server-action nor target-action. It is a criterion of
the screen, so its text is sent with every request of the grid (its own target-action) as a variable named like its
id, and the query of the grid reads it like any criterion. Make its filters optional, so an empty search leaves the
grid unfiltered; with STRINGB the text is searched anywhere in the field, and ignorecase="true" ignores the case.
To search several fields, put their filters in an <or>:
<query id="UsrLst">
  ...
  <where>
    <and>
      <or>
        <filter left-field="OpeNam" condition="like" right-variable="search" ignorecase="true" optional="true"/>
        <filter left-field="l1_nom" condition="like" right-variable="search" ignorecase="true" optional="true"/>
        <filter left-field="EmlAdr" condition="like" right-variable="search" ignorecase="true" optional="true"/>
      </or>
    </and>
  </where>
  <variable id="search" type="STRINGB" name="CrtUsrTxt" optional="true"/>
</query>
Behaviour.
- Typing filters the grid after a short pause (300 ms); Enter filters it at once (and does not submit the screen). The grid is not filtered again for the text it already shows.
- While it has text, the field shows a clear button; the button and Esc empty it and filter the grid at once.
- As every filter of the grid, a search also reloads the quick filters, so their counts follow it: give the query of the options the same search filters.
- It is a
type="search"field with its accessible name (label), the focus ring of the fields, and the tokens of the fields in the light and dark modes and the comfortable and compact densities. - The toolbar shows the search also when the grid sets
show-toolbar="false": only the row grouping controls and the Columns and Maximize buttons are hidden. - Declare at most one per grid; only the first one is used.
Quick filters
A grid can offer a few predefined filters as a group of buttons (a segmented control) at the start of its
toolbar, each one with its count, such as All 128 · Locked 3 · Without 2FA 41 · Inactive 12. Declare
a <quick-filter> inside the grid. It works in both client engines.
<grid id="GrdUsrAdm" style="expand" initial-load="query" server-action="data" target-action="UsrLst">
  <quick-filter id="CrtUsrSta" initial-load="query" target-action="UsrStaCnt" value=""/>
  <column label="PARAMETER_USER" name="Nom" />
  ...
</grid>
| Attribute | Use | Type | Description | Values |
|---|---|---|---|---|
| id | Required | String | Identifier of the quick filter, and the name of the parameter that sends its value with the grid | |
| initial-load | Required | String | Where the options come from | query (usually, to get the counts) or enum |
| target-action | Required | String | Query or enumerated that returns the options | |
| server-action | Optional | String | Server action that reloads the options | Default value is data |
| value | Optional | String | Option chosen when the screen is opened | Default: empty, the option with an empty value (All) |
| label | Optional | String | Accessible name of the group of buttons, read by screen readers. It is not shown | Note: You can use i18n files (locales). Default value is SCREEN_TEXT_FILTERS |
Options. The target returns one row per option, in the order they are shown:
| Field | Use | Description |
|---|---|---|
value | Required | Value of the option, sent when it is chosen. The option with an empty value (usually the first one, All) leaves the grid unfiltered |
label | Required | Text of the option. Note: You can use i18n files (locales) |
count | Optional | Number shown after the label. Without it the option shows only its label |
tone | Optional | Colour of the count: danger, warning, success or info. Without it the count is muted |
The query of the options receives the values of the screen, like any query, so its counts can follow the other filters of the grid. For example, All and Locked users, as the union of one count per option:
<query id="UsrStaCnt">
  <table id="ope"/>
  <constant value="1" type="INTEGER" alias="pos"/>
  <constant value="" alias="value"/>
  <constant value="QUICK_FILTER_ALL" alias="label"/>
  <field id="IdeOpe" function="CNT" alias="count"/>
  <constant value="" alias="tone"/>
  <union type="ALL" query="UsrStaCntLck"/>
  <order-by field="pos" type="ASC"/>
</query>
<query id="UsrStaCntLck">
  <table id="ope"/>
  <constant value="2" type="INTEGER" alias="pos"/>
  <constant value="1" alias="value"/>
  <constant value="QUICK_FILTER_LOCKED" alias="label"/>
  <field id="IdeOpe" function="CNT" alias="count"/>
  <constant value="danger" alias="tone"/>
  <where>
    <and>
      <filter left-field="PwdLck" condition="eq" right-variable="locked"/>
    </and>
  </where>
  <variable id="locked" type="INTEGER" value="1"/>
</query>
Value. The quick filter is a criterion of the screen: its value is sent with every request of the grid as a variable
named like its id, so the query of the grid reads it like any criterion. Make its filter optional, so the empty value
of All leaves the grid unfiltered:
<query id="UsrLst">
  ...
  <where>
    <and>
      <filter left-field="PwdLck" condition="eq" right-variable="state" optional="true"/>
    </and>
  </where>
  <variable id="state" type="INTEGER" name="CrtUsrSta" optional="true"/>
</query>
Behaviour.
- Choosing an option filters the grid; no dependency is needed.
- Every filter of the grid (a search, a
filterbutton action after a maintain, another option chosen) also reloads the options, so the counts stay current. The chosen option is kept. - When no option has the value of the quick filter, the first option is shown as chosen.
- The options are a radio group: Tab reaches the chosen option and the arrow keys move the choice (and filter the grid). The focused option shows the focus ring.
- It follows the light and dark modes and the comfortable and compact densities, with the tokens of the segmented control.
- The toolbar shows the quick filters also when the grid sets
show-toolbar="false": only the row grouping controls and the Columns and Maximize buttons are hidden. - Declare at most one per grid; only the first one is used.
Column autofilter
A column can offer a filter like the autofilter of a spreadsheet: a funnel in its header opens a menu to sort the
grid, pick the values to show from a list with their counts, or set conditions on text, numbers or dates. It is opt-in
per column: declare filter on the <column>. The filter runs on the server, in the query of the grid, so it
filters every row (not only the page shown) and keeps the database pagination. It works in both client engines,
in plain, tree and grouping grids.
| Attribute | Use | Type | Description | Values |
|---|---|---|---|---|
| filter | Optional | String | Type of the filter, and the funnel in the header | values, text, number or date. Default: no filter (no funnel) |
| filter-fields | Optional | String | Query fields the filter applies to, for a column that shows several values. A row matches when any of them matches (joined by OR) | Comma-separated field ids. Default: sort-field, else name |
What each type offers in its menu:
| Type | Menu |
|---|---|
values | Only the list of values. |
text | The list of values and Text filters: equals, does not equal, begins with, ends with, contains, does not contain, custom filter. |
number | The list of values and Number filters: equals, does not equal, greater than (or equal to), less than (or equal to), between, custom filter. |
date | The list of values as a year / month / day tree and Date filters: equals, before, after, between, today, yesterday, this week, last month, this year, custom filter. |
Filtered field. The filter compares a field of the query, not the text the cell shows. The field is the first of:
filter-fields, when the column declares it;sort-field, the same field the server sorts the column by;- the column
name.
So a column built with a computed, compound or translate filters by its sort-field, the plain field it is built
from: the list of values shows what the user sees (the label) and filters by the code (the value).
Example. The advanced search test screen (AdvSchTst) declares a filter on four columns of its grid:
<grid id="GrdAdvInl" style="expand" initial-load="query" server-action="data" target-action="AdvSchInlCst" max="10"
      saved-searches="true">
  <column label="PARAMETER_ADV_SCH_NAME" name="InlNam" sort-field="InlNam" align="left" charlength="20" filter="text"/>
  <column label="PARAMETER_ADV_SCH_STATUS" name="InlSta" sort-field="InlSta" align="left" charlength="12" filter="values"/>
  <column label="PARAMETER_ADV_SCH_COUNTRY" name="InlCtr" sort-field="InlCtr" align="left" charlength="14"/>
  <column label="COLUMN_ADV_SCH_AMOUNT" name="InlAmt" sort-field="InlAmt" align="right" charlength="12"
          component="numeric" number-format="{mDec: 2}" filter="number"/>
  <column label="COLUMN_ADV_SCH_CREATED" name="InlDat" sort-field="InlDatSrt" align="center" charlength="14"
          filter="date" filter-fields="InlDat"/>
</grid>
<query id="AdvSchInlCst" service="getAdvancedSearchCustomers">
  <field id="id" alias="InlIde"/>
  <field id="name" alias="InlNam"/>
  <field id="status" alias="InlSta" translate="AdvSchSta"/>
  <field id="country" alias="InlCtr" translate="AdvSchCtr"/>
  <field id="amount" alias="InlAmt"/>
  <field id="created" alias="InlDat"/>
  <field id="createdSort" alias="InlDatSrt"/>
  ...
</query>
The status lists its translated labels and filters by the status codes. The creation column sorts by InlDatSrt but
filters by the date InlDat, so it declares filter-fields.
What the query must offer. The server checks every filtered field against the fields of the grid query, by their identifier (the alias, else the id):
- It must be a field of the query that is printed: a field marked
noprintis rejected, so a filter cannot probe values the query never sends. - A field with an aggregate or window function cannot be filtered (it cannot be compared in a
WHERE). - A
computedorcompoundis not a query field: filter its column by the field it is built from (sort-fieldorfilter-fields).
A filter that breaks these rules (or any malformed filter) is rejected with an error message and the query is not run.
For example, on the users query UsrLst the Blocked icon column is the compound BlkIco, built from the printed
field Lck:
<column label="PARAMETER_BLOCKED" component="icon" name="BlkIco" sort-field="Lck" align="center" charlength="8"
        filter="values"/>
Behaviour.
- The funnel is outlined while the column has no filter in effect and filled while it has one. Clicking it never sorts
the column; the header still sorts it as before. Columns without
filterlook and behave exactly as before. - The menu shows, in order: sort ascending and descending (as the header does), Clear filter from «label» (disabled without a filter), the submenu of the type and the list of values. Accept applies the filter; Cancel and Esc close the menu without changes, and the focus goes back to the funnel.
- The list of values comes from the server: the distinct values of the field, with the number of rows of each one, among the rows that the other column filters keep (in cascade, as in a spreadsheet). It has a search box, (Select all) (checked, unchecked or mixed), one checkbox per value and (Blanks) for the empty values. Checking every value is the same as no filter.
- At most 1,000 values are listed; when there are more, a note says so: type in the search box to find the others. The search reloads the list after a short pause.
- A date column lists its values as a year / month / day tree and compares whole days. Today, yesterday, this week (Monday to Sunday), last month and this year are sent as a between of two dates.
- Custom filter… edits two conditions joined by And or Or. A column filters either by values or by conditions, not both.
- Numbers are typed with the decimal separator of the application (a comma in Spanish, for example).
- While any column has a filter, a Filtered by row under the toolbar shows one removable chip per filtered column (Profile: Operator, Viewer; the first three labels and then +N) and Clear all. Removing a chip or Clear all reloads the grid.
- Applying or clearing a filter reloads the grid from page 1, also in grids with
load-all="true"(they reload their rows from the server). - On a column with
filter, the native column filter ofenable-filtersis not offered: the autofilter replaces it. The other columns keep the native filter.
Server side. The grid sends its filters in the columnFilters parameter of every request, next to sort, page
and max (two requests with different filters never share a cached result). Requests without it run exactly as before.
- Database queries. The engine adds one condition per filtered column to the
WHEREof the query (also when the query has no<where>), on the expression of the field (table field, function or case), never on its alias. On aUNIONquery it filters the whole union. The values are escaped constants built by QueryDSL, never concatenated text;%and_typed by the user are matched literally; text comparisons ignore case; between includes both ends. The count and the pagination use the sameWHERE, so the pagination stays in the database. - Service, enumerated and queue queries. The same filters are applied in Java to the data list of the query, before
its sort and pagination. A field with
translateis filtered by its code. A query whose service manages its own pagination is not filtered: the parameter reaches the service unchanged. - List of values. The menu loads it with the
column-valuesserver action (/action/column-values/<grid query>), which runs the grid query with the same access checks asdata. Database queries group the values in the database; the other queries group their data list in Java. A query whose service manages its own pagination has no list of values (the action returns an error). - Print and export. Printing and the Excel and PDF exports of a grid keep its column filters.
- A column whose
idis acompound(an icon column, for example) lists the text of the whole cell as the label of each value, not the label of the compound. Columns built withtranslateorcomputedlist their labels. - A column with several
filter-fieldslists the values of its fields, not the labels of the column. - On database queries, the search in the list of values runs in the database only on
textcolumns that list their values as they are (notranslatenor transform); in the rest it searches the labels of the first 10,000 values. - A service query with
post-process="false"is not filtered. - On service queries, (Blanks) also keeps the empty texts; on database queries only the null values.
Saved searches
With saved-searches="true" a grid shows a Saved searches menu at the end of its toolbar, before the
Columns and Maximize buttons, in both engines. It works as the
saved searches of a window: each user saves, applies, renames and deletes their own
searches of the grid, and sees the ones published for their profile. Grids without the attribute show nothing new.
<grid id="GrdAdvInl" server-action="data" target-action="AdvSchInlCst" saved-searches="true">
  ...
</grid>
- What is saved. The state of the grid: its column filters (with the labels of their chips), its sort, the value of its quick filter and the text of its search. Applying a search restores that state and reloads the grid from page 1. Filters and columns that no longer exist in the screen are dropped when applying.
- What the server keeps. Only those keys. It checks every column filter with the rules of the
columnFiltersparameter and against the column declaration (samefiltertype and fields), drops the filters of columns the grid does not have, and refuses a search longer than 4,000 characters with the message The search has too many values to be saved. The fields of the query are checked when the search is applied, as in any request of the grid. - Who publishes. A user may publish searches for a profile when their menu gives access to the option of the
property
awe.saved-search.publish-option(by defaultprofiles), as for the windows. - Storage. The same
AweSavSchtable as the window searches, with the grid id in place of the window id (component ids are unique in a screen). The user and the profile are always taken from the session, and the grid must exist in the screen withsaved-searches="true". - The toolbar shows the menu also when the grid sets
show-toolbar="false".
Default search. A search can open the grid, as the default search of a window:
- Open the screen with this search, in the Save search dialog, or Set as my default in Manage searches… makes it the default search of the user for that grid. The menu marks it as Default. It may be an own search or one published for the profile of the user.
- A user who may publish marks a published search as the default of its profile with Set as the profile default (marked Profile default). The default of the user wins over the default of the profile.
- The server applies the default search before the initial load: its column filters, sort, quick filter and search reach the query, so the grid loads once, already filtered and sorted, with no second load. It applies it only when the session keeps nothing for that grid. A chip next to Saved searches names the default search applied, until another search is applied or Clear all is used.
- Clear all, in the column filter chips, returns the grid to the filters and the sort of the XML and hides the chip; the quick filter and the search keep their values. Applying the default search from the menu shows it again.
- A search that names a column the grid no longer has is applied without it, with no error.
- When the window of the grid also has a default search, both apply on the same initial load: the window fills its criteria and the grid its column filters, sort, quick filter and search.
- The default search does not carry the column layout: the visible columns and their order stay the preference of the user of the toolbar.
All of it is part of saved-searches="true": there is no new attribute, and a grid without it does not change. It uses
the storage of the window defaults, with the grid id in place of the window id (AweUsrWinCnf.DefSavSch and
AweSavSch.Def, Flyway migration AWE_V1.6.1), so it needs no migration of its own.
Empty state
A grid without rows shows an empty state instead of an empty table, in both the AngularJS and the React engines. It is
made of an icon, a title and a text. The default texts are translated; use empty-icon, empty-title and empty-text
to change them. While the grid is loading, the empty state is not shown.
The optional empty-action points to a button of the grid (a button declared inside the grid). The empty state offers
a button with the label and the icon of the referenced one, and clicking it runs the actions of that button, so it
can be used, for example, to clear the search criteria.
<grid id="UserGrid" server-action="data" target-action="UserList"
      empty-icon="search" empty-title="GRID_NO_USERS" empty-text="GRID_NO_USERS_HELP" empty-action="ClearSearch">
  <column label="USER" name="user" />
  <button id="ClearSearch" label="BUTTON_CLEAR" icon="eraser" button-type="reset" />
</grid>
Row detail
A grid can show a detail area under each row. With a <row-detail> element inside the grid, every row starts with a
toggle button; it opens, under the row and across the whole width of the grid, either a text built from a template with
the data of the row or a nested grid fed with the data of the row (see Detail with a nested grid).
It works in both client engines, and a grid without <row-detail> renders exactly as before.
<grid id="GrdThemes" style="expand" initial-load="query" server-action="data" target-action="ThemeList" max="10">
  <column label="PARAMETER_ID" name="id" align="center" charlength="10"/>
  <column label="COLUMN_THEME" name="name" align="left" charlength="30"/>
  <column label="COLUMN_CODE" name="code" hidden="true"/>
  <column label="COLUMN_ACTIVE" name="active" hidden="true"/>
  <row-detail style="row-detail-card"><![CDATA[Theme: {name}
Code: {code}
Active: {active}]]></row-detail>
</grid>
The text of the element is the template:
- Each
{name}placeholder is replaced with the fieldnameof the row. Any field of the row can be used, also the ones of hidden columns (hidden="true"), so the detail can show data that the grid does not. - When the field is a cell object, its label is shown; if it has no label, its value.
- A field that the row does not have shows nothing. A text between braces that is not a valid field name is kept as it is.
- The detail is plain text: HTML in the template or in the data is shown as text, never rendered.
- Line breaks are kept (consecutive spaces collapse into one). Use a
CDATAsection for templates with several lines, and do not indent their lines. - Declare one
<row-detail>per grid. If there are more, only the first one is used.
The <row-detail> element accepts these attributes:
| Attribute | Use | Type | Description | Values |
|---|---|---|---|---|
| style | Optional | String | CSS classes added to the detail area of every row, next to its own grid-row-detail class | Space-separated class names. Ex. row-detail-card |
| Optional | Boolean | Prints the detail under each row when the grid is printed or exported (PDF, XLSX...). See printing the detail | Default value is false |
The classes style the whole area (background, border, spacing, font); the template stays plain text, so its parts cannot be styled separately. Define the classes in the styles of your application, for example:
.grid-row-detail.row-detail-card {
  padding: 0.75rem 1rem;
  line-height: 1.7;
  border-left: 4px solid currentColor;
}
Detail with a nested grid
Instead of a template, the <row-detail> can hold a read-only grid, for example the orders of the product of the
open row. Declare it inside the <row-detail>:
<grid id="GrdProducts" style="expand" initial-load="query" server-action="data" target-action="ProductList" max="10">
  <column label="COLUMN_PRODUCT" name="name" align="left" charlength="30"/>
  <column label="COLUMN_PRODUCT_ID" name="product" hidden="true"/>
  <row-detail style="row-detail-card">
    <grid id="GrdOrders" server-action="data" target-action="OrdersOfProduct" max="10">
      <column label="COLUMN_ORDER" name="order" align="left" charlength="15"/>
      <column label="COLUMN_STATUS" name="status" align="center" charlength="10"/>
      <button id="ButOrdersHelp" label="BUTTON_HELP" icon="info-circle">
        <button-action type="confirm" target="OrdersHelpMsg"/>
      </button>
    </grid>
  </row-detail>
</grid>
or bring it from another screen with an include whose source contains only that grid:
<row-detail style="row-detail-card">
  <include target-screen="ProductOrders" target-source="orders"/>
</row-detail>
The nested grid is a normal grid definition: columns, column components and styles, sorting, paging and buttons (toolbar buttons and button columns) work as in any grid.
Data of the parent row. Every request of a nested grid (its loads, sorts and page changes, and the actions of its
buttons) sends each field of the parent row as a single value named <ParentGridId>.row.<column>, also the fields of
hidden columns. Its query reads them with a <variable> whose name is that parameter:
<query id="OrdersOfProduct">
  <table id="Orders"/>
  <field id="OrderId" alias="id"/>
  <field id="OrderCode" alias="order"/>
  <field id="Status" alias="status"/>
  <where>
    <and>
      <filter left-field="ProductId" condition="eq" right-variable="product"/>
    </and>
  </where>
  <variable id="product" type="INTEGER" name="GrdProducts.row.product"/>
</query>
A cell object of the parent row is sent as its value. Only the requests of that nested grid carry these values.
Behaviour of the nested grid.
- Each open row gets its own instance of the nested grid, with its own data, page and sort order: sorting or paging the nested grid of one row does not change the others.
- It is not a screen component: it is not loaded with the screen, it loads when its row is opened, and its values are not part of the form values of the screen (other buttons and grids of the screen do not send them).
- The identifier of an instance is
<nestedGridId>-<rowId>(for exampleGrdOrders-7), and the one of its buttons<buttonId>-<rowId>. - The instance is removed when its row closes and when the parent grid reloads its data (a new search, a reload, or a change of page or sort order served by the server), so no nested state is left behind.
- The nested grid has a fixed height of
18remin both engines; its rows scroll inside it.
Behaviour:
- Several rows can be open at the same time. The toggle does not select the row, and selecting a row does not open its detail.
- The toggle is a button: it is reached with the
Tabkey and works withEnterandSpace. It exposesaria-expanded(truewhile the detail is open),aria-controls(the identifier of the detail) and a translated label (Show row details / Hide row details). - A reload of the data closes every detail: a new search, a reload, or a change of page or sort order served by the server.
In a grid that loads all its rows (
load-all="true"), changing the page or sorting on the client keeps the open rows.
- The detail is either a template or a nested grid, never both: a
<row-detail>with text and a grid makes the screen fail to load with an error. - The components of a row detail are limited to one read-only grid, inline or through an
include. Any other component, aneditableorsend-operationsgrid, or a<dependency>inside the<row-detail>makes the screen fail to load with an error. Components outside the detail cannot target the nested grid or its buttons (target). - The column names of the nested grid must be different from the ones of the other grids of the screen, as for any grid (the screen schema requires unique column names).
- In the AngularJS engine the page of a nested grid should not exceed 50 rows (
max); larger pages are not supported. - Tree grids (
treegrid="true") do not show the row detail in either engine. - In the AngularJS engine, when the grid has frozen columns (
frozen), the detail is shown in the scrollable part only; the rows of the frozen part do not grow. - The AngularJS engine places the rows of a grid by a fixed height, so a grid with a row detail renders every row of
its page instead of virtualizing them (the page size of the grid, see
max, bounds the cost).
Printing the detail
The detail is not printed unless the <row-detail> says so with print="true" (the default is false, so printing
a grid with a detail does not change when you upgrade). With it, the print of the grid (PDF, XLSX and the other formats)
writes the detail under each printed row:
- Template: the server renders it for every row with the same
{name}rules as the screen, as plain text in a block across the width of the grid. A field is available when the grid sends it with the print data (asendablecolumn, hidden or not). - Nested grid: the server runs the query (
target-action) of the nested grid once per printed row, with the values of the row as<parent grid id>.row.<column>, as the screen does, and prints its rows as a table. It prints the columns the nested grid would print (printable, hidden and button columns as in any grid) as plain columns, up to itsmaxrows per detail (100 when it declares none). Think of the cost: a grid of 500 rows runs 500 queries. - A detail made with an
includeis not printed (the server does not resolve it) and the grid prints without it. - One level only: a nested grid cannot have a detail of its own.
- A grid that prints its detail does not group its rows (grouping is ignored on grids with
row-detail).
See what a printed grid shows for the XLSX behaviour.
The test applications include the screens Row detail and Row detail with a grid (countries with the customers of each country, inline and through an include) in the matrix test menu.
Column structure
<column label="[column-label]" name="[column-name]" sort-field="[sort-field]" align="[text-align]"
        charlength="[column-width-chars]" component="[column-component]" >
  <dependency ...> ... </dependency>
  ...
</column>
Column attributes
| Attribute | Use | Type | Description | Values |
|---|---|---|---|---|
| name | Required | String | Column identifier. For reference purposes | |
| sort-field | Optional | String | Sort field to sort by (if not treegrid) | |
| filter | Optional | String | Shows the column autofilter funnel in the header | values, text, number or date. Default: no filter |
| filter-fields | Optional | String | Query fields the column autofilter applies to, joined by OR. Only used with filter | Comma-separated field ids. Default: sort-field, else name |
| type | Optional | String | Field type (for printing purposes) | string, integer, float or date |
| hidden | Optional | Boolean | Column is not visible on screen. It can still be printed, see printing columns | Default value is false |
| printable | Optional | String | Whether the column is included in the printed report. See printing columns | true (default) or false |
| align | Optional | String | Column is not visible | left, center or right |
| width | Optional | Integer | Column width in pixels or percent. | Ex.: width = "10" or width = "20%" Note: You can use '*' value for auto: the column takes the rest of the width of the grid (its charlength is ignored). |
| sortable | Optional | Boolean | Field is sortable (if not treegrid) | Default value is true |
| movable | Optional | Boolean | Allows to move column position in the grid | Default value is true |
| sendable | Optional | Boolean | Column data must be sent to the server | Default value is true |
| charlength | Optional | Integer | Column width in chars | |
| label | Optional | String | Column label | Note: You can use i18n files (locales) |
| style | Optional | String | Column css class | Css class to apply to the column |
| component | Optional | String | Column type (if editable) | See components |
| permission | Optional | String | Permissions the user needs to see a column of component button. It replaces what is derived from the targets of its actions. See screen elements | Permission identifiers separated by spaces, all required |
| max | Optional | Integer | Max number of records to retrieve when the column is initialized with target-action | Default value is 30 |
| visibility | Optional | Boolean | Initial visibility of the column component | Default value is true |
| frozen | Optional | Boolean | Keep the column fixed out of the horizontal scroll. WARNING: Don't use this attribute if header has more than one line height. In the React engine the frozen columns move to the left, and a grid with frozen columns keeps its single-line rows (wrap and max-lines are ignored); a grouped header or a tree grid does not freeze columns in React yet | Default value is false |
| wrap | Optional | Boolean | The text of the cells wraps over several lines and the row grows to fit it. See wrapping text | Default value is false |
| max-lines | Optional | Integer | Maximum number of lines of a wrapping cell, it implies wrap. See wrapping text | A number greater than 0 |
| secondary-field | Optional | String | Row field shown under the main value, smaller and muted. See secondary line, status and chips | Name of another field of the row |
| export-secondary | Optional | Boolean | The spreadsheet exports (XLSX, CSV) add a column with the secondary field right after this one. Documents print it under the value, see what a grid prints | Default value is false |
| secondary-label | Optional | String | Title of the exported secondary column | Default: the label of the column. Note: You can use i18n files (locales) |
| status-field | Optional | String | Row field with the tone of a status: the value shows as a dot of the tone plus the text | success, warning, danger, info, neutral |
| chips | Optional | Boolean | The value is a list shown as chips | Default value is false |
| chip-separator | Optional | String | Separator of the items of a chips column | Default value is , |
| max-chips | Optional | Integer | Number of chips shown; the rest collapse into a "+n" chip | A number greater than 0 |
| bar-min | Optional | Number | Lower end of the scale of a progress column. See bar options (React engine only) | Default value is 0 |
| bar-max | Optional | Number | Upper end of the scale of a progress column | Default value is 100 |
| bar-second-field | Optional | String | Row field drawn as a second bar, of the same thickness, under the main one | Name of another field of the row |
| bar-stack-fields | Optional | String | Row fields drawn as consecutive segments of the bar | Comma-separated field names |
| bar-leaf-only | Optional | Boolean | In a tree grid, only the leaves draw the bar | Default value is false |
| avatar-field | Optional | String | Row field with the name (or initials) the avatar before the value is built from. See avatar | Name of another field of the row |
| avatar-tone-field | Optional | String | Row field with the tone of the avatar | primary, info, success, warning, danger, neutral |
| avatar-icon-field | Optional | String | Field of the row with an icon drawn in the avatar instead of the initials, on the tone of avatar-tone-field. A row without icon falls back to the initials | Icon name (lucide:name, fa-name...) |
| swatch-field | Optional | String | Row field with a colour drawn as a circle before the value, in the place of the avatar. See swatch | An AWE 5 palette name or a #RGB / #RRGGBB hex |
| icon-field | Optional | String | Row field with an icon shown before the value; with status-field it takes the place of the dot. See icon | Name of another field of the row |
Note: When a column is editable (it has a component) all attributes of criteria can be used in the column. See criteria attributes for more references.
Wrapping text
By default the text of a cell is one line, cut with an ellipsis when it does not fit in the width of the column. A column can declare that its text wraps over several lines, and the row grows to fit the tallest cell of the row. It works in both client engines and a grid without these attributes renders exactly as before.
<grid id="GrdComments" style="expand" initial-load="query" server-action="data" target-action="CommentList">
  <column label="Code" name="code" align="left" charlength="8"/>
  <column label="Title" name="title" align="left" charlength="16" wrap="true"/>
  <column label="Description" name="description" align="left" charlength="30" max-lines="3"/>
</grid>
wrap="true"shows the whole text over as many lines as it needs.max-lines="N"limits the text toNlines. When the text is longer, lineNends in an ellipsis, and the full text shows in a tooltip on hover and on keyboard focus (the cut cells can be reached with theTabkey, andEsccloses the tooltip).max-linesimplieswrap, unless the column declareswrap="false".- The rest of the columns keep their single line. Selection, sorting, inline editing and the keyboard shortcuts of the grid work as usual with taller rows.
row-heightis the minimum height of the rows of a grid, with or without wrapping columns, in both engines. Tree grids ignore it.
A text that does not wrap and does not fit in the width of its column always exposes its whole value: in the React engine, text cells and headers show it as a tooltip (the AngularJS engine already did it for cells).
- Only the text of standard cells wraps. The cells of columns with a
componentkeep their own layout. - The AngularJS engine places the rows of a grid by a fixed height, so a grid with wrapping columns renders every row
of its page instead of virtualizing them (the page size of the grid, see
max, bounds the cost). A grid with frozen columns (frozen) or a tree grid keeps its single-line rows in that engine.
The test applications include the screen Wrapping cells in the matrix test menu, with 100 rows of wrapping columns.
Secondary line, status and chips
A standard cell can show more than its value without HTML in the data: a secondary line under the main value, a status (a dot of a tone plus the text) or a list of chips. It works in both client engines, the rows grow to fit (also with wrapping text) and a grid without these attributes renders exactly as before.
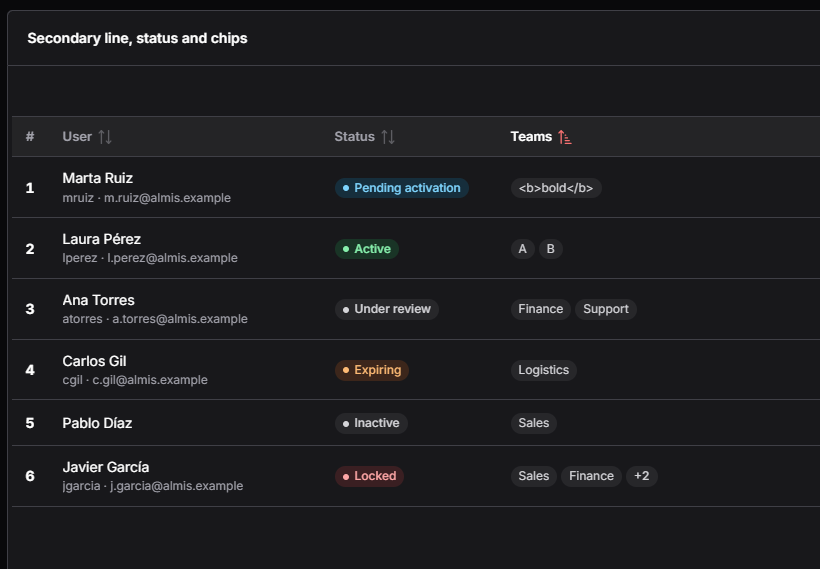
<grid id="GrdUsers" style="expand" initial-load="query" server-action="data" target-action="UserList">
  <column label="User" name="user" charlength="30" secondary-field="login" export-secondary="true" secondary-label="Login"/>
  <column label="Status" name="status" charlength="18" status-field="tone"/>
  <column label="Teams" name="teams" charlength="24" chips="true" max-chips="2"/>
  <column label="Login" name="login" hidden="true"/>
  <column label="Tone" name="tone" hidden="true"/>
</grid>
| Attribute | JSON | Default | Description |
|---|---|---|---|
secondary-field | secondaryField | Name of another field of the row, shown under the main value, smaller and muted. Empty: only the main line | |
export-secondary | exportSecondary | false | The spreadsheet exports (XLSX, CSV) add a column with the secondary field right after the main one. PDF and the other documents print the secondary line under the value, in the same cell, whatever this attribute says |
secondary-label | secondaryLabel | the column label | Title (i18n key) of the exported secondary column |
status-field | statusField | Name of a field of the row with the tone: success, warning, danger, info or neutral. The tone is trimmed and lower-cased; an unknown or empty tone is neutral | |
chips | chips | false | The value is split by chip-separator, each item is trimmed, the empty ones are dropped and each one shows as a chip |
chip-separator | chipSeparator | , | Separator of the items of a chips column |
max-chips | maxChips | Show the first N chips and a "+n" chip whose tooltip and accessible label list the hidden items |
chipsandstatus-fieldare exclusive: withchips="true"the status is ignored.secondary-fieldcombines with plain text and with a status.- Columns with a
componentignore the three features. - The tone of a status is never shown by colour alone: the dot always goes with the text.
- A status longer than its column ends in an ellipsis, and its tooltip (
title) shows the whole text. - Values are always rendered as text, never as HTML: a value like
<b>bold</b>shows literally. - Sorting and filtering use the main value. The spreadsheet exports write the main value and, with
export-secondary="true", the secondary value in its own column, titled withsecondary-labeland with the width and alignment of the main column. The print to PDF and the other documents show the secondary line under the main value, see what a printed grid shows.
Grids loaded by query read the secondary and status values from the row on the server. Grids whose print data is sent
by the client (load-all, editable or multioperation grids) send, besides their columns, the secondary field and the
status field of the printed columns, so they do not have to be columns of the grid (they can also be hidden="true", as
login in the example).
Example: users with their account and state
The query returns the main values and the fields the cells read: account for the secondary line and tone for the
status (the text of the status stays translatable, the tone does not).
<query id="UserStateList">
  <table id="ope" alias="ope"/>
  <field id="IdeOpe" table="ope" alias="id"/>
  <field id="OpeNam" table="ope" alias="name"/>
  <field id="l1_nom" table="ope" alias="login"/>
  <field id="EmlAdr" table="ope" alias="email"/>
  <!-- Secondary line: login and email in one field -->
  <computed alias="account" format="[login] · [email]"/>
  <!-- Status: the text and its tone, computed from the active flag -->
  <case alias="state">
    <when left-field="l1_act" condition="eq">
      <right-operand><constant value="0" type="INTEGER"/></right-operand>
      <then><constant value="Inactive"/></then>
    </when>
    <else><constant value="Active"/></else>
  </case>
  <case alias="tone">
    <when left-field="l1_act" condition="eq">
      <right-operand><constant value="0" type="INTEGER"/></right-operand>
      <then><constant value="neutral"/></then>
    </when>
    <else><constant value="success"/></else>
  </case>
</query>
<grid id="GrdUserState" style="expand" initial-load="query" server-action="data" target-action="UserStateList">
  <column label="PARAMETER_USER" name="name" sort-field="name" charlength="30"
          secondary-field="account" export-secondary="true" secondary-label="PARAMETER_EMAIL"/>
  <column label="PARAMETER_STATUS" name="state" sort-field="state" charlength="16" status-field="tone"/>
  <!-- The fields the cells read, also as hidden columns (needed by the export of client-sent grids) -->
  <column name="account" hidden="true"/>
  <column name="tone" hidden="true"/>
</grid>
A list in one field (for example Sales;Finance;Support) shows as chips; here with ; as separator and at most
three chips plus "+n":
<column label="PARAMETER_ROLES" name="roles" charlength="30" width="*" chips="true" chip-separator=";" max-chips="3"/>
Avatar
A column can show a small round avatar with initials before its value (and its secondary line), as the user list of the
design system. The avatar is built from a field of the row with a name: the engine takes the first letter of its first
and its last word that start with a letter, in upper case (Carmen Fernández is CF, Pat de la Vega is PV,
admin is A), the same rule as the avatar of the React header.
<column label="PARAMETER_USER" name="FulNam" sort-field="FulNam" charlength="30" width="*"
        secondary-field="UsrSec" avatar-field="Ini" avatar-tone-field="IniTon"/>
<column name="Ini" hidden="true"/>
<column name="IniTon" hidden="true"/>
| Attribute | JSON | Default | Description |
|---|---|---|---|
avatar-field | avatarField | Name of a field of the row with the name (or initials separated by spaces) the avatar is built from. Empty or without letters: no avatar, and an empty space of the same size keeps the values of the column aligned | |
avatar-tone-field | avatarToneField | neutral | Name of a field of the row with the tone: primary, info, success, warning, danger or neutral. The tone is trimmed and lower-cased; an unknown or empty tone is neutral |
- It combines with
secondary-fieldandstatus-field; columns with acomponentignore it. - The avatar is decorative (
aria-hidden): the value of the cell is its accessible text. Its initials are text, never HTML. - Sorting, filtering, print and export use the main value only.
- To give each record a stable colour, compute the tone from its identifier in the query, for example its identifier
modulo the number of tones translated with an enumerated group (the users screen does it with
user-avatar-tone):
<operation operator="MOD" alias="IniIdx">
  <field id="IdeOpe" table="ope"/>
  <constant value="6" type="INTEGER"/>
</operation>
<computed format="[IniIdx]" alias="IniTon" translate="user-avatar-tone"/>
Swatch
A column can show a small circle filled with a colour of the row before its value (and its secondary line), in the place
of the avatar, as the themes screen does with the primary colour of each theme. The colour is read from a field of the
row: an AWE 5 palette name, drawn with its 500 shade of the design tokens (var(--awe-palette-<name>-500)), or a hex
colour.
<column label="PARAMETER_THEME" name="NamVal" sort-field="NamVal" charlength="30" width="*"
        secondary-field="ThmSec" swatch-field="Pri"/>
<column name="Pri" hidden="true"/>
| Attribute | JSON | Description |
|---|---|---|
swatch-field | swatchField | Name of a field of the row with the colour: red, orange, amber, yellow, lime, green, emerald, teal, cyan, sky, blue, indigo, violet, purple, fuchsia, pink, rose, slate, gray, zinc, neutral or stone (trimmed, in any case), or a #RGB / #RRGGBB hex. Any other value draws no circle: an empty space of the same size keeps the values of the column aligned |
- Only those values reach the style of the circle: the client checks the value against the palette names and a hex pattern, so a field can never inject other CSS.
- With
avatar-fieldtoo, the swatch is shown while the row has a valid colour, and the avatar otherwise. - It combines with
secondary-fieldandstatus-field; columns with acomponentignore it. - The circle is decorative (
aria-hidden): the value of the cell is its accessible text. Sorting, filtering, print and export use the main value only.
Icon
A column can show an icon of the row before its value, as the two-factor column of the users screen. The icon is read
from a field of the row (lucide:shield-check, fa-check... as any icon of the screens). With status-field the icon
takes the place of the dot, so the status is a plain tag; a row without icon shows the tag with its text only.
<column label="PARAMETER_2FA" name="2faTxt" sort-field="2fa" charlength="12" status-field="2faTon" icon-field="2faIcn"/>
<column name="2faTon" hidden="true"/>
<column name="2faIcn" hidden="true"/>
| Attribute | JSON | Default | Description |
|---|---|---|---|
icon-field | iconField | Name of a field of the row with the icon. Empty, or an unknown Lucide name: no icon (and, in a status, no dot either) |
- It combines with
status-field,secondary-fieldandavatar-field; columns withchips="true"or acomponentignore it. - The icon is decorative (
aria-hidden): the value of the cell is its accessible text, so give every row a text (for exampleOnandOff), not only an icon. - Sorting, filtering, print and export use the main value only.
- The users screen computes the three fields in
UsrLst: the translated text (user-2fa-label), the icon only when two-factor is on, and a constantneutraltone:
<case alias="2faIcn">
  <when left-field="enable2fa" left-table="ope" condition="eq" right-variable="One">
    <then><constant value="lucide:shield-check"/></then>
  </when>
  <else><constant value=""/></else>
</case>
<constant value="neutral" alias="2faTon"/>
The test applications include the screen Secondary line, status and chips in the matrix test menu (the user column has an avatar).
Printing columns
When a screen is printed (see the print engine guide), each grid decides which columns go to
the report using the printable attribute of the column:
printable | Printed in PDF, DOCX and TEXT | Printed in XLSX and CSV |
|---|---|---|
| not set | Only when the column is on screen | Only when the column is on screen |
true | Always, even if hidden="true" | Always, even if hidden="true" |
excel | Never | Always, even if hidden="true" |
false | Never | Never |
Button columns (component="button") are never printed nor exported, whatever their
printable value.
Both engines apply these rules and the server applies them again, so a column with printable="false" is never in the
report whatever the client sends.
What each column prints (secondary lines, statuses, chips, progress bars, sparklines, formatted text) is explained in what a printed grid shows.
"On screen" means the column is not hidden="true" and it has not been hidden at runtime by a hide-column
dependency action. Declaring printable="true", printable="excel" or printable="false" takes precedence
over the screen state.
This makes it possible to show a styled value on screen while exporting the raw value:
<grid id="GrdAmounts" server-action="data" target-action="QryAmounts" load-all="true">
  <!-- Shown on screen with HTML styling, excluded from the report -->
  <column label="AMOUNT" name="Amount" align="right" charlength="20" printable="false"/>
  <!-- Hidden on screen, printed as a numeric value in every format -->
  <column label="AMOUNT" name="AmountRaw" align="right" charlength="20" hidden="true" type="float" printable="true"/>
  <!-- Hidden on screen, exported to the spreadsheet only -->
  <column label="INTERNAL_CODE" name="Code" charlength="10" hidden="true" printable="excel"/>
</grid>
Keep in mind:
- A printed column needs its data in the client, so it must be
sendable(the default). Asendable="false"column appears in the report header with empty cells. - Use
type(string,integer,float,date) on printed columns so spreadsheet cells get the right format. - Columns inside a
group-headerkeep their grouping in the report. Columns of the group that are not printed in a format are left out, and the group header disappears when none of its columns is printed. - When a print request mixes spreadsheet and document formats and some column is
printable="excel", AWE designs the report twice, once per kind of output. Grids that print from a query run that query once per design. - The values
allandtab, accepted by the schema in earlier versions, have been removed. Replaceallwithtrue.
Column components
| Component | Description |
|---|---|
| text | Text column component. See text criterion |
| password | Password column component. See password criterion |
| textarea | Textarea column component. See textarea criterion |
| numeric | Numeric column component. See numeric criterion |
| date | Date column component. See date criterion |
| time | Time column component. See time criterion |
| filtered-date | Filtered date column component. See filtered date criterion |
| select | Select column component. See select criterion |
| suggest | Suggest column component. See suggest criterion |
| select-multiple | Select multiple column component. See select multiple criterion |
| suggest-multiple | Suggest multiple column component. See suggest multiple criterion |
| checkbox | Checkbox column component. See checkbox criterion |
| radio | Radio column component: the options of a list as a row of radio buttons. See radio column component |
| button-radio | Radio column component: the options of a list as one joined bar of buttons. See radio column component |
| color | Color column component. See color criterion |
| uploader | Uploader column component. See uploader criterion |
| text-view | Text view column component. See text view criterion |
| formatted-text | HTML Text column component. See formatted-text component |
| icon | Icon column component. Shows the icon named by the cell value. |
| image | Image column component. Use it for showing images in a column. |
| button | Component which allows the user to click a button which launches a set of button-action |
| progress | Progress column component. Useful for showing a progress bar in a column. See progress |
| sparkline | Sparkline column component: a small line, bar or area chart of a series of numbers. See sparkline column component |
| link | HTML Link component. Opens an URL in a new page |
Specific row style
When you need set specific style to all cells of one row (ex.: change background color), you can add a new field called _style_ with CSS style name.
<query id="MyQuery" >
    <field id="_style_" alias="_style_" variable="styleClass"/>
    <variable id="styleClass" type="STRING" value="red"/>
</query>
Theme classes
AWE provides ready-made CSS classes for two common grid looks. They are available in both client engines and in every theme, light or dark, so an application does not need to write its own CSS.
Grid without header row
Add the grid-no-header class to the style of the grid. The header row is hidden but it keeps taking part in the
layout of the columns, so the columns keep their widths (charlength and width). It is useful for compact lists.
<grid id="GrdCompactList" style="expand grid-no-header" initial-load="query" server-action="data" target-action="CompactList">
  <column label="Name" name="name" align="left" charlength="30"/>
  <column label="Description" name="description" align="left" charlength="40"/>
</grid>
The header is not available to screen readers while it is hidden, and neither are the sort, filter and column menu controls of the header. Use the class on grids that do not need them.
Colour-scaled cells (heat maps)
The query assigns one of the following classes to each cell with the style attribute of a
compound cell. Every class paints the whole cell and sets its own text colour, so the text keeps
a contrast of at least 4.5:1 (WCAG AA) in every theme.
| Scale | Classes | Use it for |
|---|---|---|
| Sequential (blue) | scale-seq-1 (lowest) to scale-seq-5 (highest) | Values that go from low to high |
| Diverging, positive (green) | scale-pos-1 (lowest) to scale-pos-5 (highest) | Values above the reference (e.g. gains) |
| Diverging, negative (red) | scale-neg-1 (lowest) to scale-neg-5 (highest) | Values below the reference (e.g. losses) |
For example, a query that colours the amount in the positive or negative scale depending on its value:
<query id="Results">
<table id="Results"/>
<field id="Name" alias="name"/>
<field id="Amount" alias="amount" noprint="true"/>
<compound alias="result">
<computed alias="value" format="[amount]"/>
<computed alias="label" format="[amount]"/>
<computed alias="style" format="[amount] < -50 ? 'scale-neg-5' : [amount] < 0 ? 'scale-neg-2' : [amount] < 50 ? 'scale-pos-2' : 'scale-pos-5'" eval="true"/>
</compound>
</query>
The test applications include the screens Grid without header and Colour scales in the matrix test menu, with an example of each class.
Specific column components
There are several components developed specifically to be used in grid cells. These components need a special structure on the query which fills them:
<compound alias="specialCell">
  <computed alias="value" format="xxx"/>
  <computed alias="label" format="xxx" translate="EnumTranslate"/>
</compound>
These are the cells which use the special structure:
Standard cell without components
When you send a compound structure to a standard cell, you can use the following attributes:
| Attribute | Description |
|---|---|
| value | Value which will be sent to the server |
| label | Text which will be shown. You can use i18n files (locales) |
| title | Text to show when you move the mouse over the icon. You can use i18n files (locales) |
| style | CSS class to format the contents |
Text view column component
This component is very useful to show an styled text inside a grid with an icon. The compound attributes to fill this component are the following:
| Attribute | Description |
|---|---|
| value | Value which will be sent to the server |
| label | Text which will be shown. You can use i18n files (locales) |
| title | Text to show when you move the mouse over the icon. You can use i18n files (locales) |
| icon | Icon class. You can check all iconset at icons screen |
| unit | Unit label (shown on the right of the cell). You can use i18n files (locales) |
| style | CSS class to format the contents |
Icon column component
This component is very useful to show an icon inside a grid. The compound attributes to fill this component are the following:
| Attribute | Description |
|---|---|
| value | Value which will be sent to the server |
| label | Text to show when you move the mouse over the icon. You can use i18n files (locales) |
| title | Text to show when you move the mouse over the icon. You can use i18n files (locales) |
| icon | Icon class. You can check all iconset at icons screen |
| style | CSS class to format the contents |
Formatted text column component
This component is used to show HTML code inside a grid. It works like a text view
(read-only, launches a click event and accepts icon, unit and style), but its label is rendered as HTML instead
of plain text. The label is not translated.
The HTML is sanitized before it is shown, so scripts, event handlers and other active content never reach the page.
In the React client the label keeps only text formatting tags (b, strong, i, em, u, s, small, mark,
span, p, br, h1-h6, lists, code, pre, blockquote...), links and the attributes class, href, target
and title. Images, frames, inline styles and javascript: links are removed. It is the same policy as the text of
any other grid cell.
Image column component

This component is used to show an image inside a grid. The compound attributes to fill this component are the following:
| Attribute | Description |
|---|---|
| value | Value which will be sent to the server |
| label | Alternate text. You can use i18n files (locales) |
| title | Text to show when you move the mouse over the icon. You can use i18n files (locales) |
| image | Image path |
| style | CSS class to format the contents |
Button column component
A button column is a component which allows to launch a set of button-action defined on column.
| Attribute | Description |
|---|---|
| value | Value which will be sent to the server |
| label | Text to show in the button. You can use i18n files (locales) |
| title | Text to show when you move the mouse over the button. You can use i18n files (locales) |
| icon | Icon class to show in the button. You can check all iconsets at icons screen |
| style | CSS class to format the contents |
The label, title, icon and style can be attributes of the column (the same for every row) or come in the data of
the cell (they override the ones of the column). The btn-* styles and no-label of the button styles
apply to the buttons of the column too (btn-ghost for row actions).
- The button acts on its row. A click on the button of a row selects that row, and only it, before its actions run, so the dependencies on the selected row (a side panel filled with the row, for example) and the parameters the actions send are the ones of that row. A row that is already the only selected one is left as it is (a row being edited keeps being edited). In a multiselect grid the other selected rows are unselected. Both client engines do it.
- Icon-only cells. A cell button without label shows only its icon; its
title(the one of the cell, else the one of the column) is its tooltip and its accessible name. - Button columns are actions, not data. They are never listed in the Columns of the toolbar and never
printed nor exported (Excel, CSV, PDF, print), whatever their
printablevalue, in both engines and on the server. Row action columns are usually not sortable and not sent either:sortable="false" sendable="false".
Row actions as in the AWE 5 design system, a pencil that edits the row and an ellipsis that opens the context menu of the grid:
<column name="EdtBtn" component="button" icon="lucide:pencil" title="BUTTON_EDIT" style="btn-ghost no-label"
        align="center" charlength="4" sortable="false" sendable="false">
  <button-action type="value" target="PnlMod" value="edit" />
  <button-action type="dialog" target="PnlUsr" />
</column>
<column name="MorBtn" component="button" icon="lucide:ellipsis" title="BUTTON_MORE_ACTIONS" style="btn-ghost no-label"
        align="center" charlength="4" sortable="false" sendable="false">
  <button-action type="show-context-menu" />
</column>
Radio column component
The radio and button-radio columns show all the options of a list in every cell and the user chooses one of them.
The options come from the column in the same way as in a select column: with initial-load and target-action
(for instance an enumerated, enum, or a query) and every option has a value and a label. The value of the chosen
option is the value of the cell.
<enumerated>
  <group id="LevelOptions">
    <option label="Low" value="L"/>
    <option label="Medium" value="M"/>
    <option label="High" value="H"/>
  </group>
</enumerated>
<grid id="GrdTheme" style="expand" initial-load="query" server-action="data" target-action="ThemeList" send-all="true">
  <column label="Theme" name="name" align="left" charlength="30"/>
  <column label="Level" name="level" component="radio" initial-load="enum" target-action="LevelOptions" align="center" charlength="30"/>
  <column label="Mode" name="mode" component="button-radio" initial-load="enum" target-action="ModeOptions" align="center" charlength="30"/>
</grid>
| Attribute | Description |
|---|---|
| initial-load | How the options are loaded: enum for an enumerated, query for a query |
| target-action | Enumerated group or query that provides the options (value and label of each one) |
| label | Header of the column. It is also the accessible name of the group of options of every cell |
| validation | required requires a choice in every row |
| readonly | A read-only column, or a read-only cell, cannot be changed |
To start with a choice, the query that fills the grid returns the value of the option in a field named like the column
(here level, with L, M or H). A row where that field is empty or null starts without choice.
The column behaves like any other column of the grid: it can be sorted, validated, edited and printed.
radio look
Every option is a radio button followed by its label, and the options of a cell are in one line. When the column is
narrow, the React engine wraps them onto more lines, while the AngularJS engine keeps one line and hides what does not fit,
so give the column enough width (for example with charlength). The checked radio has the primary colour of the theme.
button-radio look
The options of a cell are one joined bar of buttons (a segmented control), like the button radio criterion: adjacent buttons share their borders, only the two ends of the bar are rounded and the chosen option is highlighted.
Keyboard, validation and read-only
| Behaviour | Description |
|---|---|
| Keyboard | The left and right arrow keys move the choice between the options of the cell (the up and down ones too) and go round at both ends; Tab leaves the cell |
| Accessibility | The options of a cell are a radiogroup labelled with the label of the column, and the radios of a row share one name |
| Validation | With validation="required" a row without choice is not valid |
| Read-only | A read-only column, or a read-only cell, cannot be changed |
The chosen option cannot be unchecked by itself, only by choosing another one.
Data sent to the server
The grid sends the column in the same way as a select column: a list with one value per row (in the same order as the
other columns), the chosen option of each row and null for a row without choice:
{
  "id": [12, 3, 7],
  "level": ["M", null, "H"],
  "level.selected": "H"
}
<column>has the chosen value of each row sent (all the rows when the grid hassend-all, the selected ones otherwise).<column>.selectedhas the value of the selected rows.<column>.editinghas the value of the rows being edited, in editable and multioperation grids.
The maintain target reads the list as a variable named like the column (<variable id="level" type="STRING" name="level"/>).
Progress column component

The progress component is very useful to show the status of a job, or a task.
| Attribute | Description |
|---|---|
| value | Value (in percentage (0-100) of the progress bar |
| label | Text to show in the progress bar (ie percentage) |
| title | Text to show when you move the mouse over the button. You can use i18n files (locales) |
| style | CSS class to format the contents |
Progress bar options
By default a progress column draws the PrimeReact progress bar of the table above. With any of the attributes below it
draws a data bar behind the number instead: the number stays visible, right-aligned, over a light bar. The value is a
number (or a numeric string) positioned between bar-min and bar-max, so a value like 4.13 of a maximum of 40 fills
10.325 % of the cell, and a negative value fills to the left of the zero. This works in the React engine only; the AngularJS engine keeps the plain progress bar. Print and
export write the value of the cell, never the bar.
| Attribute | JSON | Default | Description |
|---|---|---|---|
bar-min | barMin | 0 | Lower end of the scale |
bar-max | barMax | 100 | Upper end of the scale. A scale where bar-max is not above bar-min, or that is not numeric, is 0 to 100 |
bar-second-field | barSecondField | Name of a field of the row drawn as a second bar, with the same scale and signed rules. With it the cell shows two thin rounded bars, one above the other | |
bar-stack-fields | barStackFields | Comma-separated names of fields of the row. The bar draws one segment per field, one after another from the zero | |
bar-leaf-only | barLeafOnly | false | In a tree grid only the leaves draw the bar, the rest of the rows show an empty cell |
- The bar fills the height of the row behind the number; with a second value the two thin rounded bars share that height, the main one above (data bar colour) and the second below (neutral).
- The fill goes from the zero to the value. Values outside the scale are clamped to its ends. The zero is
0clamped to the scale, and an axis line on it shows only when the scale goes from a negative to a positive number (the signed scale). On a signed scale the end of the fill on the axis is square and only the outer end is rounded. - Negative values use the negative data bar colour and their number the danger text colour, positive ones the data bar colour. An empty or non-numeric value draws nothing.
- In
bar-stack-fieldsonly positive numbers draw a segment (the others are skipped), each segment is cut at the end of the scale and the colour of the segment follows the position of its field in the three tones of the data scale, and then it starts again. - The bar is a
meterfor assistive technologies (aria-valuemin,aria-valuemax,aria-valuenowand a text with the value as the cell shows it, also shown as the tooltip). With a second value the text ismain / second, and with segmentstotal (part + part). - In a flat grid every row is a leaf.
<!-- A value of 4.13 over a maximum of 40: the bar fills 10.325 % -->
<column label="Usage" name="usage" component="progress" bar-max="40" align="center"/>

<!-- Signed bar: -10 on a scale of -40 to 40 fills from 37.5 % to the zero mark in the middle -->
<column label="Variation" name="variation" component="progress" bar-min="-40" bar-max="40"/>

<!-- Second value: the bar under the main one reads the field "target" of the row -->
<column label="Sales" name="sales" component="progress" bar-max="200" bar-second-field="target"/>
<column label="Target" name="target" hidden="true"/>

<!-- Stacked segments: one per field, from the zero -->
<column label="Tickets" name="total" component="progress" bar-max="100" bar-stack-fields="open,blocked,closed"/>
<column label="Open" name="open" hidden="true"/>
<column label="Blocked" name="blocked" hidden="true"/>
<column label="Closed" name="closed" hidden="true"/>

<!-- Tree grid: only the leaves draw the bar -->
<column label="Progress" name="done" component="progress" bar-leaf-only="true"/>
Sparkline column component
A sparkline draws a small chart of a series of numbers inside the cell, so a trend per row (sales per month, load per
day) can be seen without opening a chart. The value of the cell is a JSON array of numbers, for example
[3, 5, -1, 8]. The query can return it as text or as an already parsed list.
<column label="LOAD" name="load" component="sparkline" sparkline-type="bar" sparkline-negative-color="#d64550" charlength="14"/>
| Attribute | Description | Values |
|---|---|---|
| sparkline-type | Drawing of the series: a connected line, one bar per value, or a line with the area under it filled | line (default), bar or area |
| sparkline-color | Colour of the series. A value that is not a plain colour is ignored | Any CSS colour, ex.: #3b82f6 |
| sparkline-negative-color | Colour of the negative values: the bars below zero, or the parts of the line and the area that go below zero. Without it the negative values use the colour of the series | Any CSS colour |
| sparkline-last-point | Highlights the last point of the series: a dot on lines and areas, a dark outline on bars | true or false (default) |
| sparkline-min-max | Marks the lowest point (red) and the highest point (green) of the series with a dot | true or false (default) |
How the series is drawn:
- The chart is an SVG of 100 by 24 pixels, drawn in the same way by both client engines. Give the column enough
width (
charlength="14"or more); the cell alignment (align) places the chart inside the cell. - Bars and negative values: bars start at the zero line, so the negative ones hang below it. Lines and areas are scaled to the lowest and highest values; a thin grey zero line is drawn whenever the series has a negative value.
- Tooltip: hover a point to see its value. Each point has a hit area as wide as its share of the chart.
- Single value: lines and areas draw one dot, bars draw one bar.
- Empty or invalid series: the cell is left empty, with no error. That is the case of an empty value,
[], a text that is not JSON, a value that is not a list, and a list with any item that is not a number. - The cell is a display component: it is not editable and not a tab stop (the chart is not focusable), so it does not get in the way of the keyboard navigation of the grid.
- The legacy jQuery sparkline plugin of the AngularJS client has been removed; applications that used its CSS classes
(
jqstooltip,stats-sparklines) must provide their own.
Group header structure
<group-header label="[group-header-label]" name="[group-header-name]">
  <column...> ... </column>
  ...
</group-header>

Group header attributes
| Attribute | Use | Type | Description | Values |
|---|---|---|---|---|
| name | Required | String | Group header identifier. For reference purposes | |
| label | Optional | String | Group header label | Note: You can use i18n files (locales) |
Basic grid
The basic grid is the standard grid without a tree structure. It can be defined as single-select grid, multiselect grid, editable grid or multi-option grid, and combinations between them.
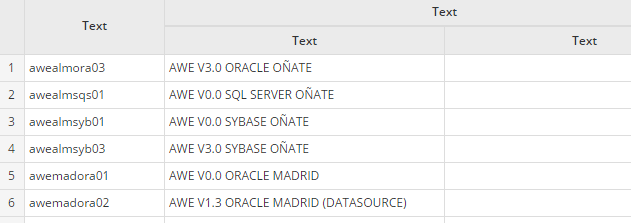
Basic grid specific attributes
| Attribute | Type | Description | Values |
|---|---|---|---|
| show-totals | Boolean | Show a line with totalizers | Default value is false |
| row-numbers | Boolean | Show the row numbers | Default value is false |
Row grouping
A basic grid can group its rows by one or more columns, in both client engines: each group shows a row with its
value, its number of rows and the aggregates of the group, can be collapsed and expanded, and ends with a subtotal row.
The toolbar offers Expand all, Collapse all and, with group-selector="true", a Group by panel to change the
grouping at runtime. A grid without these attributes renders exactly as before. The toolbar keeps its order: the
search, the quick filters and the grouping controls at its start, the Columns and Maximize
buttons at its end; show-toolbar="false" hides the grouping controls with the Columns and Maximize buttons.
<grid id="GrdSales" style="expand" initial-load="query" server-action="data" target-action="SalesByStore" max="10"
      group-by="region,country,city" group-selector="true" show-totals="true">
  <column label="Region" name="region" sort-field="region" charlength="24"/>
  <column label="Country" name="country" sort-field="country" charlength="14"/>
  <column label="City" name="city" sort-field="city" charlength="14"/>
  <column label="Store" name="store" sort-field="store" charlength="12"/>
  <column label="Sales" name="sales" sort-field="sales" align="right" charlength="12" component="numeric"
          number-format="{mDec: 0}" summary-type="sum"/>
  <column label="Average price" name="price" sort-field="price" align="right" charlength="14" component="numeric"
          number-format="{mDec: 2}" summary-type="avg"/>
</grid>
| Attribute | JSON | Default | Description |
|---|---|---|---|
group-by | groupBy | Comma-separated column names; each one is a grouping level, in order. Unknown names are ignored | |
group-selector | groupSelector | false | The toolbar shows a Group by button whose panel changes the levels at runtime: No grouping, or the checked columns in the order they are checked. It offers the visible columns with a label and without summary-type |
group-subtotals | groupSubtotals | true | Each expanded group ends with a subtotal row. false hides it |
The aggregates reuse the summary-type of the columns (sum, avg, max or min) and their number-format; the
columns without it show nothing in the group and subtotal rows.
Loading and pagination. A grid with group-by or group-selector="true" loads every row of its query, as if it
had load-all="true", whatever its load-all: server pagination is not used. While the rows are grouped the grid does
not paginate (the pager is hidden, every group is shown with scroll and a group is never split across pages); with No
grouping it paginates its rows on the client again with its max. Expand all, Collapse all, a group toggle and the
Group by panel work on the loaded rows, without a server call. Keep grouped grids to the size that a load-all grid
handles well.
Behaviour, the same in both engines:
- Group row: the toggle (chevron, with
aria-expanded), the value of the group (the label of select and suggest cells; an empty value shows a translated (empty)) and{count}, the data rows of the group, muted and after a space in the first visible column, and the aggregates in their columns. Subtotal row:Subtotal {value}and the aggregates. - Classes for per-level styling:
grid-group-row grid-group-level-{n}andgrid-subtotal-row grid-subtotal-level-{n}(nfrom 1). The default style indents and weights each level with the design tokens, in light and dark. - Groups start expanded. A click on a group row (or Enter and Space on its toggle) expands or collapses it and never selects it. Expand all and Collapse all act on every group of every level and set the state of the groups shown later: after Collapse all, the groups shown by expanding their parent are collapsed too. The state of each group is kept across sorting and reloads while the levels stay the same.
- Ordering: without a sort on them, the groups of each level go by their value, ascending, the empty group last.
Sorting by a group-by column orders its level by value in that direction; sorting by a column with
summary-typeorders the groups of every level by that aggregate. Any sort also orders the data rows inside each group. show-totals="true"keeps the footer as the grand total of all the rows.- Group and subtotal rows are display rows: they have no checkbox, row number, edit or context menu actions. The model of the grid keeps the data rows, so the selection, the values sent to the server, the print and the export are those of the data rows, without groups or subtotals. The print and the export build their own group and subtotal rows from them, see printing a grouped grid.
- Column filters (
enable-filters) are not offered while the rows are grouped, and come back with No grouping. - Grouping is ignored on tree grids and on editable,
send-operations,move-rowsandrow-detailgrids.
Known limits:
- A column with
summary-typethat is the first visible column shows the label of the group, not its aggregate. - Changing the levels with the Group by panel forgets the groups expanded or collapsed one by one.
- React:
maxover only negative values gives0(as its footer); AngularJS gives the true maximum. - AngularJS: the footer always sums, whatever the
summary-type(the group and subtotal rows do use it); while grouped, the select-all checkbox of a multiselect grid selects the rows shown (not the ones inside collapsed groups).
Printing a grouped grid
A grouped grid prints with the grouping the user has chosen at that moment: both engines send the columns that group
the rows (also none, when the user chose No grouping), and the server falls back to group-by only when the client sends
nothing. The printout shows, for every group, a row with its value, its number of rows and the aggregates of the columns with
summary-type, then its rows, and a subtotal row when group-subtotals is not false; the grand total goes last when
show-totals is on. Every group is printed expanded. See
what a printed grid shows for the details and the limits.
The test applications include the screen Row grouping in the matrix test menu (three levels, Group by panel and grand total).
Multiselect grid
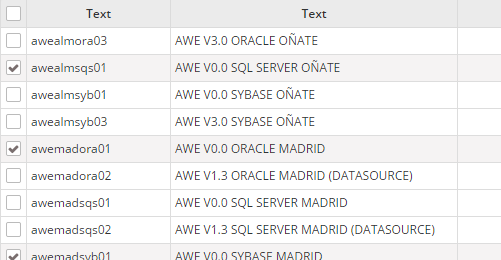
Multiselect grid specific attributes
| Attribute | Type | Description | Values |
|---|---|---|---|
| multiselect | Boolean | Allow selecting more than one line | Default value is false |
| checkbox-multiselect | Boolean | Allow selecting more than one line, but clicking only on the side checkboxes | Default value is false |
Non-selectable grid
| Attribute | Type | Description | Values |
|---|---|---|---|
| selectable | Boolean | Allow selecting rows by clicking them. With false the grid never selects a row | Default value is true |
With selectable="false" a click on a row neither selects nor deselects it, no row is highlighted (not even when hovered),
and the selection checkbox column of multiselect is not shown. The events of the cells (click dependencies and the
buttons of the columns) keep firing. Use it for grids whose rows only trigger actions, for example with a button column,
where the first click used to select the row and the next one to deselect it.
- A cell button still acts on its own row: its actions and dependencies read that row, which is registered as the selected row of the model, but it is never shown as selected.
- Dependencies on the
select-rowevent of the grid do not fire from a row click. - Supported by the React engine; the AngularJS engine ignores the attribute. Tree grids are not affected.
Tree grid
The tree grid is a grid that can be expanded as a tree. It can be defined as standard tree, loading tree, editable tree or multi-option tree, and combinations between them.
The data structure needs an identifier per row, and also a parent identifier, with no value if the row is a root row (with no parent). The identifier field must be defined on the grid tree-id attribute, and the parent must be defined on the tree-parent attribute.
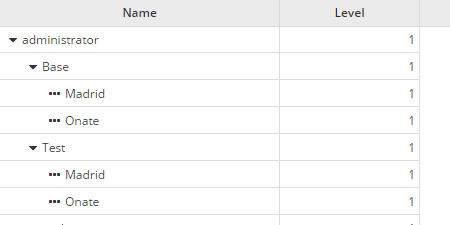
Tree grid specific attributes
| Attribute | Type | Description | Values |
|---|---|---|---|
| treegrid | Boolean | Set grid as treegrid | Default value is false |
| tree-id | String | Define identifier field | Default value is id |
| tree-parent | String | Define parent field | Default value is parent |
| tree-leaf | String | Define the 'is leaf' field | Default value is isLeaf |
| expand-column | String | Name of the column to be expanded | Must be a column identifier |
| initial-level | Integer | Initial level to expand | Default value is 1 |
| icon-expand | String | Icon of a branch without expand | Note: You can check all iconsets at icons screen |
| icon-collapse | String | Icon of a expanded branch | Note: You can check all iconsets at icons screen |
| icon-leaf | String | Icon of a leaf branch | Note: You can check all iconsets at icons screen |
A tree grid has the toolbar (<search> and <quick-filter>), the rich cells (status-field, secondary-field), the row
buttons (component="button") and the selection bar of the flat grid, in both engines. With
multiselect="true" each row has a checkbox and the header a select-all checkbox, as in the flat grid, and the selected
rows are sent and counted the same way. Each row is selected on its own: selecting a parent does not select its
children.
A tree grid with load-all="true" shows all its rows in one page and has no paginator, in both engines: a branch is
never split between pages.
Editable grid
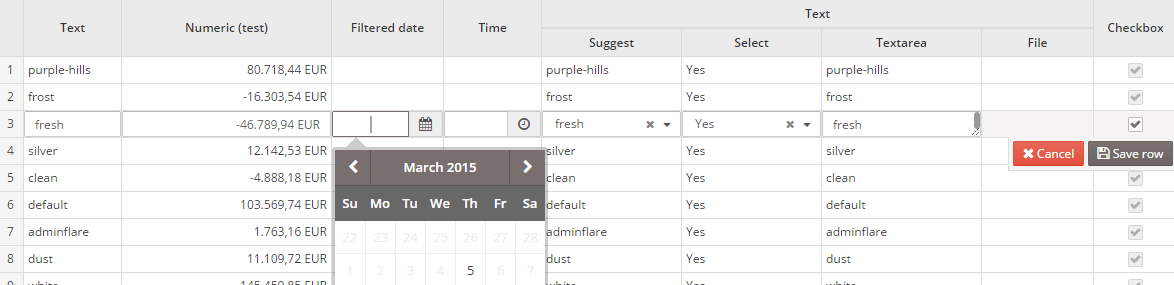
Editable grid specific attributes
| Attribute | Type | Description | Values |
|---|---|---|---|
| editable | Boolean | Allow editing the grid rows | Default value is false |
Moving rows
An editable grid can reorder its rows with four client actions that move the selected row: move-row-top, move-row-up,
move-row-down and move-row-bottom. See the actions page. The rows keep the new order in the grid model, so
that order is the one the grid sends to the server when it is saved (set send-all="true" to send every row, not only the
selected ones). The order of the rows is stored in the position of the values of each column list, and an application
that wants to keep it must save that position (for instance in an order column).
<grid id="GrdSteps" editable="true" send-all="true" server-action="data" target-action="StepList">
  <column name="name" label="COLUMN_NAME" component="text"/>
  <button label="BUTTON_MOVE_ROW_UP" icon="angle-up" id="ButStepUp">
    <button-action type="move-row-up" target="GrdSteps" silent="true"/>
    <dependency target-type="enable" initial="true">
      <dependency-element id="GrdSteps" attribute="selectedRows" condition="eq" value="1"/>
    </dependency>
  </button>
</grid>
With a row selected, both web engines also move it with the keyboard while the grid has the focus:
| Keys | Action |
|---|---|
Alt+ArrowUp | move-row-up |
Alt+ArrowDown | move-row-down |
Alt+Home | move-row-top |
Alt+End | move-row-bottom |
The actions are ignored when the row is already in that position, and tree grids do not support them. The shortcuts work
when the grid is editable or has move-rows.
Drag and drop
With move-rows="true" the grid adds a narrow leading column with a grip on every row, in both web engines. The pointer
shows the move cursor over the grip. Drag a row by its grip and a line marks where it lands, before or after the row under
the pointer; drop it to move the row there. Only the grip starts a drag, so the cells keep their text selection and clicks.
Tree grids do not show the grip.
<grid id="GrdSteps" move-rows="true" send-all="true" server-action="data" target-action="StepList">
  <column name="name" label="COLUMN_NAME" component="text"/>
</grid>
A drop reorders the rows as the move-row actions do: the grid model keeps the new order in its values and the moved row
ends up selected. The AngularJS engine also stores the move-row event, as the actions do. The grid does not need to be
editable, and the Alt+Arrow shortcuts above stay available as the keyboard alternative: the grip has an accessible label
that mentions them. Grids without move-rows look and behave as before.
Multioption grid
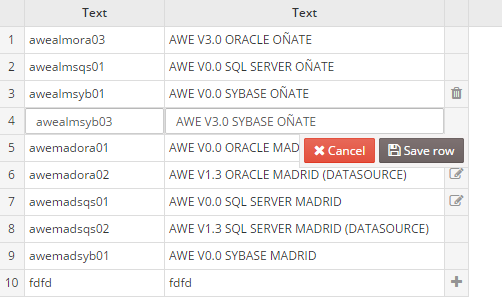
Note: The multioption grid will send a variable called
[GridId]-RowTyp(where[GridId]is the identifier of the grid) containing the action done in each row (INSERT,UPDATEorDELETEactions)
Multioption grid specific attributes
| Attribute | Type | Description | Values |
|---|---|---|---|
| send-operations | Boolean | Allow editing the grid rows, but sending only the modified lines | Default value is false |
Grid buttons
You can add button elements to perform actions over the grids. For instance, a pair of buttons to insert and delete rows.
<grid id="GrdKeyLst" style="expand" initial-load="query" server-action="data" target-action="AweKeyLst" send-operations="true" editable="true" max="40">
  <column label="COLUMN_NAM" name="KeyNam" sort-field="KeyNam" align="left" charlength="20" component="text" validation="required">
    <dependency source-type="query" server-action="unique" target-action="AweKeyUni">
      <dependency-element id="GrdKeyLst" column="KeyNam" attribute="currentRowValue" />
    </dependency>
  </column>
  ...
  <button label="BUTTON_NEW" icon="plus-circle" id="ButGrdKeyLstAdd">
    <button-action type="add-row" target="GrdKeyLst" silent="true" />
  </button>
  <button label="BUTTON_DELETE" icon="trash" id="ButGrdKeyLstDel">
    <button-action type="delete-row" target="GrdKeyLst" silent="true" />
    <dependency target-type="enable" initial="true">
      <dependency-element id="GrdKeyLst" attribute="selectedRows" condition="==" value="1" />
    </dependency>
  </button>
</grid>
Selection bar
The buttons that act on the selected rows (Reset 2FA, Delete...) can leave the footer and be shown in a selection
bar: it appears between the toolbar and the header of the grid while one or more rows are selected, with a
check, the number of selected rows (2 selected) and those buttons at the end, small and in the order of the screen.
It disappears when no row is selected, also after a reload of the grid that clears the selection. Add
selection="true" to each of these buttons. It works in both client engines.
<grid id="GrdUsrAdm" style="expand" initial-load="query" server-action="data" target-action="UsrLst" multiselect="true">
  <column label="PARAMETER_USER" name="Nom" />
  ...
  <button label="BUTTON_NEW_USER" icon="plus-circle" id="ButNew">...</button>
  <button label="BUTTON_RESET_2FA" icon="shield" id="ButRst2fa" selection="true">
    <button-action type="check-some-selected" target="GrdUsrAdm" />
    <button-action type="confirm" target="Rst2faMsg" />
    <button-action type="server" server-action="maintain" target-action="reset2fa" />
    <button-action type="filter" target="GrdUsrAdm" />
  </button>
  <button label="BUTTON_DELETE" icon="trash" id="ButDel" style="btn-danger" selection="true">
    <button-action type="check-some-selected" target="GrdUsrAdm" />
    <button-action type="confirm" target="DelMsg" />
    <button-action type="server" server-action="maintain" target-action="UsrDel" />
    <button-action type="filter" target="GrdUsrAdm" />
  </button>
</grid>
| Attribute | Use | Type | Description | Values |
|---|---|---|---|---|
| selection | Optional | Boolean | The button of the grid is shown in its selection bar instead of in its footer | Default value is false |
Behaviour.
- The buttons keep all their behaviour: their actions, dependencies (enable, show...), confirmations and their id, so the tests and the other buttons that refer to them do not change. Only their place changes. The other buttons of the grid stay in the footer, and a grid without selection buttons has no bar.
- The buttons are small ghost buttons; the destructive one is the button with the danger style of AWE,
style="btn-danger", drawn filled with the danger colour. - The text is the locale
SCREEN_TEXT_GRID_SELECTED_ROWfor one row andSCREEN_TEXT_GRID_SELECTED_ROWSfor more, with{{count}}for the number ({{count}} selected). - In a grid without
multiselectthe bar shows the one selected row. - The bar takes the band of the grid toolbar while rows are selected, with the same height, so the rows and the header never move: it covers the search, the quick filter, the saved searches and the group by, and the Columns and Maximize buttons stay at the right. In a grid without toolbar it covers the row of the column headers, leaving the select-all checkbox visible.
- After the count, a chip shows the context of the selection: the label of the active quick filter (not the "all"
option) and the search text, read as
SCREEN_TEXT_FILTERED_BY(Filtered by). Filtering or searching clears the selection. - A clear button at the start of the bar (
SCREEN_TEXT_GRID_CLEAR_SELECTION,Clear selection) and the Esc key in the grid unselect every row, one or many; while a row is being edited, Esc cancels the edition instead. After clearing, the focus goes to the search of the grid, or to the select-all checkbox when it has no search. - The bar is a polite live region (
aria-live="polite"), so screen readers announce the number of selected rows; its buttons follow the text in the tab order and are out of it while the bar is hidden. It uses the highlight tokens of the selected rows in the light and dark modes and the comfortable and compact densities, and it appears with a short fade that stops withprefers-reduced-motion.
Context menu
You can define a context-menu inside the grid to help the user do actions with the selected rows. See context menu.
Variables
The grid component sends some specific variables to the server, depending on its status and attributes. Here is the list of variables that can be sent by the grid component:
| Variable | Type | Condition | Description |
|---|---|---|---|
| [GridName] | Array | Always | List of selected lines identifiers |
| [GridName]-id | Array | Always | List of row identifiers for rows with operations |
| [ColumnName] | Array | send-all="false" | List of selected lines column values (for each column) |
| [ColumnName] | Array | send-all="true" | List of all column values (for each column) |
| [ColumnName].selected | Value/Array | Always | List of selected lines column values (for each column). If there is only one row selected, it will send only the value instead of an array |
| [GridName].selectedRowAddress | JsonNode | When there is only one line selected | Json node with the address of the selected row: view, component and row id (and column when a cell calls the action) |
| sort | Array | When sorting | List of JsonNodes with the grid sort information (id: column id, direction: sort direction) |
| [GridName].data | JsonNode | Always | List of grid extra information (page, max records, sort information, etc) |
The multioperation grid sends the variables in a different way than the other grids:
| Variable | Type | Condition | Description |
|---|---|---|---|
| [GridName] | Integer | multioperation="true" | Number of sent operations |
| [GridName].RowTyp | Array | multioperation="true" | List of operations required for each column (only for the rows with operations) |
| [GridName]-id | Array | Always | List of row identifiers for rows with operations |
| [ColumnName] | Array | multioperation="true" | List of column values for rows with operations (for each column) |
| [ColumnName].selected | Value/Array | Always | List of selected lines column values (for each column). If there is only one row selected, it will send only the value instead of an array |
| [GridName].selectedRowAddress | JsonNode | When there is only one line selected | Json node with the address of the selected row: view, component and row id (and column when a cell calls the action) |
| sort | Array | When sorting | List of JsonNodes with the grid sort information (id: column id, direction: sort direction) |
| [GridName].data | JsonNode | Always | List of grid extra information (page, max records, sort information, etc) |
Note: See samples of usages on Service Definition
Action called from a cell
When the action is launched by a component of a grid cell (a button, a select, a checkbox, a text view...), that row is
selected first and [GridName].selectedRowAddress carries the address of the cell: view, component (the grid),
row (the row id) and column (the id of the column of the cell). An action that does not come from a grid cell keeps
sending the address of the selected row, without column. A multiselect grid keeps the rows the user selected and
still sends the address of the cell.
{"view": "report", "component": "GrdUsr", "row": 4, "column": "Status"}
A service can read it to know which cell made the call, e.g. to colour it, as shown in Service Definition.