Charts
AWE uses Highcharts library for chart development. Esta biblioteca de javascript permite construir muchos tipos de gráficos dinámicos de forma fácil, rápida y flexible. No tiene dependencias de ninguna otra biblioteca. Es compatible con la mayoría de los navegadores actuales y tiene un alto rendimiento.
Compatibilidad con navegadores
| Marca | Versión soportada |
|---|---|
| Internet Explorer | 6.0+ |
| Firefox | 2.0+ |
| Chrome | 1.0+ |
| Safari | 4.0+ |
| iOS (Safari) | 9.0+ |
| Android Browser | 2.0+ |
Note: Highcharts is open source library for non comercial applications. For commercial purposes, you must purchase a license to use it.
Conceptos del gráfico
To get to grasp with how Highcharts works it is important to understand the various parts or concepts of a chart. A continuación hay una imagen y una descripción que muestran los conceptos principales en un gráfico.
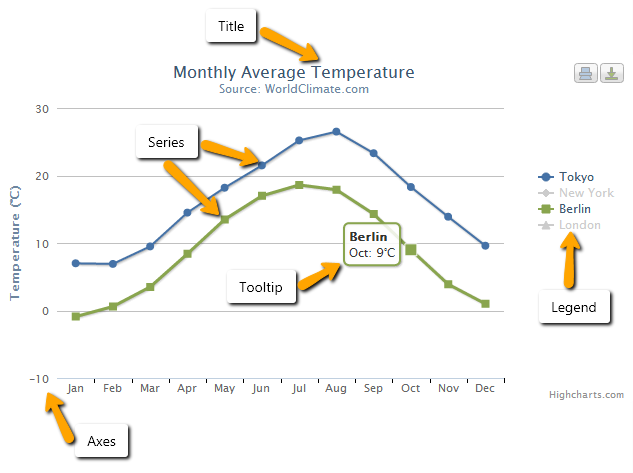
- Title: Is the text that will be presented at the top of a chart. También se pueden añadir subtítulos para describir con más detalle el gráfico.
See chart for more information in XML structure.
- Series: Is one or more series of data presented on a chart.
See series for more information in XML structure.
- Tooltip: When hovering over a series or a point on the chart you can get a tooltip that describes the values on that perticular part of the chart.
See tooltip for more information in XML structure.
- Legend: The legend show the data series in the graph and allows for enabling and disabling one or more series.
See legend for more information in XML structure.
- Axis: The x and y-axis of the chart, can also use multiple axes for different dataseries. La mayoría de los tipos de gráficos, como los cartesianos típicos de línea y de columna, tienen ejes.
See axis for more information in XML structure.
Conceptos destacados
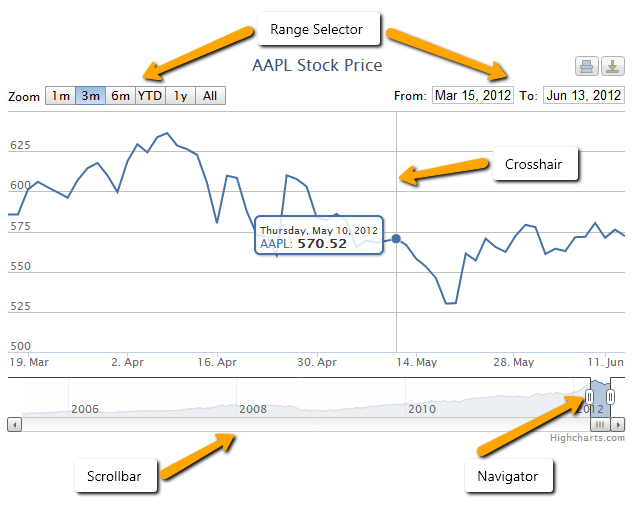
Highstock se basa en Highcharts, lo que significa que tiene toda la funcionalidad básica de Highcharts, además de algunas características adicionales. Se recomienda utilizar Highstock cuando se desea mostrar la evolución de una cantidad de datos elevada a lo largo del tiempo. Ejemplo: cuando desea mostrar los cambios del par de divisas spot en un periodo de tiempo.
-
Navigator: Allows you to fine tune the range of the chart which is displayed.
-
Range selector: Allows you to quickly select a range to be shown on the chart or specify the exact interval to be shown.
-
Scrollbar: Allows scrolling on the chart.
-
Crosshair: Shows a line following the tooltip of a chart to better read results of the x-axis. Esta funcionalidad se puede encontrar en la opción tooltip. Las crucetas también se pueden utilizar en Highcharts, pero no están habilitadas por defecto.
Esqueleto de XML
La estructura básica del gráfico es la siguiente:
<chart id="[Chart Id]" label="[Chart title]" subtitle="[Chart subtitle]" type="[Type chart]" initial-load="[Initial load]" target-action="[Action]">
  <chart-legend layout="[Layout]" align="[Align]" verticalAlign="[Vertical align]" />
  <x-axis label="[Label X-Axis]" type="[Type axis]"/>
  <y-axis label="[Label Y-Axis]"/>
  <chart-tooltip suffix="[Suffix value]" number-decimals="[Decimal numbers]"/>
  <chart-serie id="[Serie ID]" x-value="[X-Values]" y-value="[Y-value]" label="[Serie label]" />
  <chart-parameter type="[Type parameter]" name="[Name parameter]">
    <chart-parameter type="[Type paramter]" name="[Name parameter]" value="[Parameter value]"/>
  </chart-parameter>
</chart>
Estructura general del gráfico
Para facilitar el desarrollo, no todas las etiquetas son necesarias.
| Elemento | Uso | Varias instancias | Descripción |
|---|---|---|---|
| chart | Required | No | Nodo global del gráfico. Describe los atributos generales del gráfico. Título, tipo, qué consulta lo genera, ... |
| chart legend | Opcional | No | Describe la leyenda del gráfico |
| chart tooltip | Opcional | No | El tooltip aparece al pasar sobre un punto de una serie. Por defecto, el tooltip muestra los valores del punto y el nombre de la serie |
| x-axis | Required | No | Describe el eje X del gráfico |
| y-axis | Required | Si | Describe el eje Y del gráfico. Es posible tener múltiples ejes y enlazarlos con diferentes series de datos |
| chart serie | Required | Si | Una serie es un conjunto de datos. It's represented as list of arrays with two values, [[x1,y1], [x2,y2]]. Cada array es un punto en la serie representado por el eje |
| chart parameter | Opcional | Si | Son parámetros extra para sobrescribir la estructura del gráfico |
Elemento gráfico
El elemento gráfico tiene los siguientes atributos:
| Atributo | Uso | Tipo | Descripción | Valores |
|---|---|---|---|---|
| id | Required | String | Identificador del gráfico | |
| label | Opcional | String | Es el título del gráfico | Note: You can use i18n files (locales) |
| subtitle | Opcional | String | Es el subtítulo del gráfico | Note: You can use i18n files (locales) |
| type | Required | String | Tipo de gráfico | line, spline, column, column_3d, area, areaspline, arearange, areasplinerange, pie, pie_3d, donut, donut_3d, semicircle, mixed |
| stock-chart | Opcional | Boolean | Indicador de tipo de gráfico de stock | true o false |
| theme | Opcional | String | Es el nombre del tema del gráfico | Note: It must be exist the name of chart style |
| inverted | Opcional | Boolean | Invertir los ejes para que el eje x sea vertical y el eje y sea horizontal. Cuando es true, el eje x es revertido por defecto. | true o false |
| stacking | Opcional | String | Si se deben apilar los valores de cada serie encima de la otra | normal o percent |
| enable-data-labels | Opcional | Boolean | Mostrar o no las etiquetas de los datos hasta que la animación inicial de la serie haya terminado. | Por defecto es true |
| format-data-labels | Opcional | String | Usar para formatear el texto de la etiqueta de los datos. | Ej. Point y with 3 decimals format-data-labels="{y:.3f}" |
| zoom-type | Opcional | String | Decide en qué dimensiones el usuario puede acercar arrastrando el ratón | xAxis, yAxis o all |
| carga-inicial | Required | String | Para cargar el gráfico cuando se genera la pantalla | Note: Only can have the 'query' value |
| target-action | Required | String | Es el nombre de la consulta que carga el gráfico | |
| max | Opcional | Number | Número de puntos a mostrar | Note: 0 stands for all elements |
| carga de íconos | Opcional | String | Establecer el icono de carga | spinner (default), square, circles, carpet, dots, folding, squarebar, circlebar, cubes, icon, custom, none |
Eje
El elemento eje tiene los siguientes atributos:
| Atributo | Uso | Tipo | Descripción | Valores |
|---|---|---|---|---|
| label | Opcional | String | Es el nombre del eje | Note: You can use i18n files (locales) |
| label-format | Opcional | String | Formato del texto para la etiqueta del eje | Defaults to {value} Ex.: Add unit to axis label-format = "{value} ºC" |
| formatter-function | Opcional | String | Función Javascript para formatear las etiquetas de los ejes. | Note: See this for more info. |
| label-rotation | Opcional | Number | Rotación de las etiquetas en grados | Por defecto a 0 |
| type | Opcional | String | El tipo de eje. | Puede ser uno de "linear", "logarithmic", "datetime" o "category". Por defecto es linear |
| tick-interval | Opcional | Number | El intervalo de las marcas de separación en unidades de eje | Note: Note that datetime axes are based on milliseconds, so for example an interval of one day is expressed as 24 * 3600 * 1000. For more information read this |
| allow-decimal | Opcional | Boolean | Permitir decimales en las marcas de separación de este eje. Cuando se cuentan números enteros, como personas o coincidencias en una página web, los decimales deben evitarse en las etiquetas de las marcas de separación del eje | Por defecto es "true" |
| opposite | Opcional | Boolean | Mostrar el eje en el lado opuesto al usual. La normal es en el lado izquierdo para los ejes verticales y el inferior para horizontal, así que los lados opuestos serán de derecha y superior respectivamente | Por defecto es "false" |
Formateador de funciones del eje
La lista de formateadores de funciones son:
formatCurrencyMagnitude: function to format a currency number with its maginute.
Ej.:
300 a 300
100000 a 100K
1234 a 1.23K
12000000 a 12M
Elemento leyenda
El elemento leyenda tiene los siguientes atributos:
| Atributo | Uso | Tipo | Descripción | Valores |
|---|---|---|---|---|
| label | Opcional | String | Es el título de la leyenda | Note: You can use i18n files (locales) |
| enabled | Opcional | Boolean | Para activar o desactivar la leyenda en el gráfico | Por defecto es "true" |
| border-width | Opcional | Number | El ancho del borde dibujado alrededor de la leyenda | Por defecto a "0" |
| layout | Opcional | String | El diseño de los elementos de la leyenda | Puede ser uno de "horizontal" o "vertical". Por defecto es "horizontal" |
| align | Opcional | String | La alineación horizontal de la caja de la leyenda dentro del área del gráfico | Puede ser uno de "izquierda", "centro" o "derecha". Por defecto es "center" |
| verticalAlign | Opcional | String | La alineación vertical de la caja de leyenda | Puede ser uno de "arriba", "mediano" o "fondo". Por defecto es "abajo" |
| floating | Opcional | Boolean | Cuando la leyenda está flotando, el área de la parcela ignora y se permite colocarla debajo de ella | Puede ser uno de "verdadero" o "falso". Por defecto es "false" |
Elemento tooltip
El elemento tooltip tiene los siguientes atributos:
| Atributo | Uso | Tipo | Descripción | Valores |
|---|---|---|---|---|
| enabled | Opcional | Boolean | Para activar o desactivar la descripción en el gráfico | Por defecto es "true" |
| crosshairs | Opcional | String | Muestra el cruce de caminos para conectar los puntos con sus correspondientes valores del eje | Puede ser uno de "xAxis", yAxis o "all". |
| number-decimals | Opcional | Number | Valor de la descripción de formato ajustando el número de decimales | |
| suffix | Opcional | String | Formatear el valor del tooltip añadiendo una cadena de sufijo | Ex.: suffix = " ºC" |
| prefix | Opcional | String | Formatear valor tooltip añadiendo una cadena de prefijo | Ex.: prefix = "Temp. " |
| point-format | Opcional | String | El HTML de la línea del punto en la descripción del punto. Las variables están encerradas por llaves | Ex.: point-format = '{series.name}: <b>{point.y}</b><br/>' Fore more info, read this |
| date-format | Opcional | String | Para series en ejes de fechas, el formato de fecha en la cabecera de la descripción se adivinará por defecto basándose en los puntos de datos más cercanos. Este miembro da las representaciones de cadena por defecto utilizadas para cada unidad | Ex.: date-format = "%Y-%m-%d" Fore more info, read this |
| shared | Opcional | Boolean | Descripción compartida para múltiples series de gráficos | Por defecto es "false" |
Elemento serie
El elemento serie tiene los siguientes atributos:
| Atributo | Uso | Tipo | Descripción | Valores |
|---|---|---|---|---|
| id | Required | String | Identificador de serie | |
| label | Opcional | String | Es el nombre de la serie. Este valor se muestra en la leyenda | Note: You can use i18n files (locales) |
| type | Opcional | String | Tipo de serie | line, spline, column, pie, area, areasplin, bar or scatter Note: If there are several series of different type, you should set the type attribute of chart element to "mixed" |
| color | Opcional | String | Se utiliza para establecer un color para la serie | Note: You can use name of colors or hexadecimal code. Ex.: color = "red" or color = "#BF0B23" |
| x-value | Required | String | Define el valor del punto en el eje x. It corresponds to the alias attribute of the field in the query | |
| y-value | Required | String | Define el valor del punto en el eje y. It corresponds to the alias attribute of the field in the query | |
| z-value | Opcional | String | Define el valor del punto en el eje z. It corresponds to the alias attribute of the field in the query | |
| x-axis | Opcional | Number | Al usar ejes x dobles o múltiples, este número define a qué xAxis está conectada la serie en particular. Se refiere al identificador del eje | El valor por defecto es 0 |
| y-axis | Opcional | Number | Al usar ejes dobles o múltiples, este número define a qué ejes yAxis está conectada la serie en particular. Se refiere al identificador del eje | El valor por defecto es 0 |
| drilldown-serie | Opcional | String | Identificador de la serie de desglose | Note: View this example |
| drilldown | Opcional | Boolean | Marcar para indicar si la serie se utiliza en un subgráfico | "true" o "false" |
Elemento parámetro de gráfico
Se utiliza para sobrescribir valores en elementos de gráfico. Tiene los siguientes atributos:
| Atributo | Uso | Tipo | Descripción | Valores |
|---|---|---|---|---|
| type | Required | String | Tipo de parámetro de gráfico | Puede ser uno de "string", "integer", "long", "float", "double", "boolean", "array", "object" o "null". |
| name | Required | String | Nombre del parámetro gráfico | |
| value | Opcional | String | Valor del parámetro gráfico |
Conceptos de series y consultas
En esta sección, explica cómo funciona la integración entre la serie de gráficos y el motor de consultas de Awe. Hay que tener en cuenta el concepto de serie en highcharts. The series are represented as list of arrays with two values, [[x1,y1], [x2,y2]]. Cada array es un punto en la serie representada por el eje.
Por lo tanto, debe establecer los valores de x e y para el punto de una serie. For this, exist the serie attributtes x-value and y-value.
This attributes corresponds to the alias attribute of the field in the query. Veamos el siguiente ejemplo:
- XML code of chart element
<chart id="ChrBarTst" label="CHART_2" type="column_3d" initial-load="query" target-action="TstChrThrDatSrc">
  <x-axis label="SCREEN_TEXT_CHART_AXIS_DATES" type="datetime"/>
  <y-axis label="Temperaturas (ºC)"/>
  <chart-serie id="serie2-1" x-value="dates" y-value="serie1" type="column" label="SCREEN_TEXT_CHART_SERIE_1" />
  <chart-serie id="serie2-2" x-value="dates" y-value="serie2" type="column" label="SCREEN_TEXT_CHART_SERIE_2" />
  <chart-serie id="serie2-3" x-value="dates" y-value="serie3" type="column" label="SCREEN_TEXT_CHART_SERIE_3" />
</chart>
- Query code to load chart
  <!-- GET THREE DATA SERIES WITH DATES -->
  <query id="TstChrThrDatSrc" distinct="true">
    <table id="HISAweDbs"/>
    <field id="HISdat" transform="DATE_MS" function="TRUNCDATE" alias="dates"/>
    <computed format="(1/(parseInt(Math.random()*10,10)+1))*10" eval="true" `alias="serie1"` transform="NUMBER"/>
    <computed format="(parseInt(Math.random()*10,10)+1)+2" eval="true" alias="serie2" transform="NUMBER"/>
    <computed format="((parseInt(Math.random()*10,10)+1)*2)-4" eval="true" alias="serie3" transform="NUMBER"/>
    <order-by field="dates" type="ASC"/>
  </query>
In this example, you can see the attribute x-value = "dates" of chart serie is equal to attribute alias in field element and the attribute y-value = "serie1" is equal to alias in the query.
Note: If the axis type is datetime, highchart library expects you to do a transform to format date as long value. Un timestamp de fecha JavaScript (milisegundos desde el 1 de enero de 1970). Awe provides transform = "DATE_MS".
Ejemplos
You can see a lot of chart examples in highcharts demo page
A continuación, muestra ejemplos construidos con el motor de gráficos AWE:
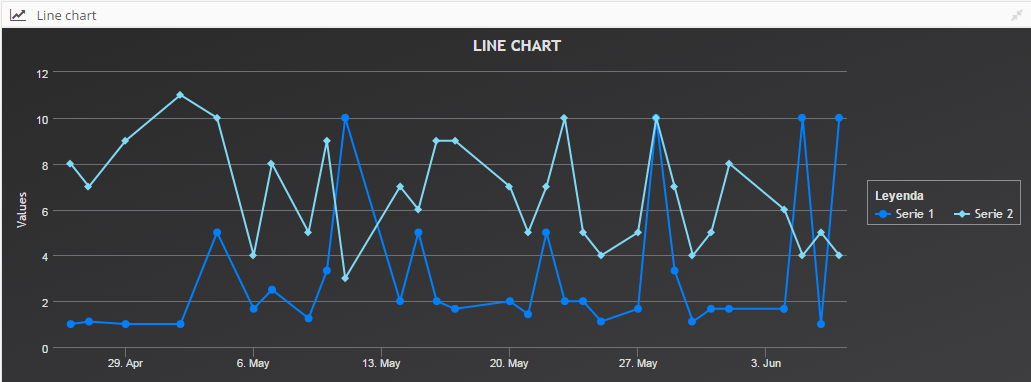
Line chart
- Line chart XML
<window label="SCREEN_TEXT_LINE_CHART" maximize="true" icon="line-chart" style="expand">
   <chart id="ChrLinTst" label="SCREEN_TEXT_LINE_CHART" type="line" theme="dark-unica" initial-load="query" target-action="TstChrTwoSrc" zoom-type="xAxis" max="30" >
     <chart-legend label="Leyenda" verticalAlign="middle" align="right" border-width="1"/>
     <x-axis label="Fechas" type="datetime"/>
     <y-axis label="Temperaturas (ºC)"/>
     <chart-tooltip crosshairs="xAxis" suffix=" ºC" number-decimals="1"/>
     <chart-serie id="serie-1" x-value="dates" y-value="serie1" label="Serie 1" color="#0080FF"/>
     <chart-serie id="serie-2" x-value="dates" y-value="serie2" label="Serie 2" color="#81DAF5"/>
     <context-button id="CtxLinTstRef" label="BUTTON_RELOAD" icon="refresh">
       <button-action type="server" server-action="data" target-action="TstChrTwoSrc" target="ChrLinTst"/>
     </context-button>
   </chart>
</window>
- Query XML
  <!-- GET TWO DATA SERIES -->
  <query id="TstChrTwoSrc" distinct="true">
    <table id="HISAweDbs"/>
    <field id="HISdat" function="TRUNCDATE" alias="dates" transform="DATE_MS"/>
    <computed format="(1/(parseInt(Math.random()*10,10)+1))*10" eval="true" alias="serie1" transform="NUMBER"/>
    <computed format="parseInt(Math.random()*10,10)+2" eval="true" alias="serie2" transform="NUMBER"/>
    <order-by field="dates" type="ASC"/>
  </query>
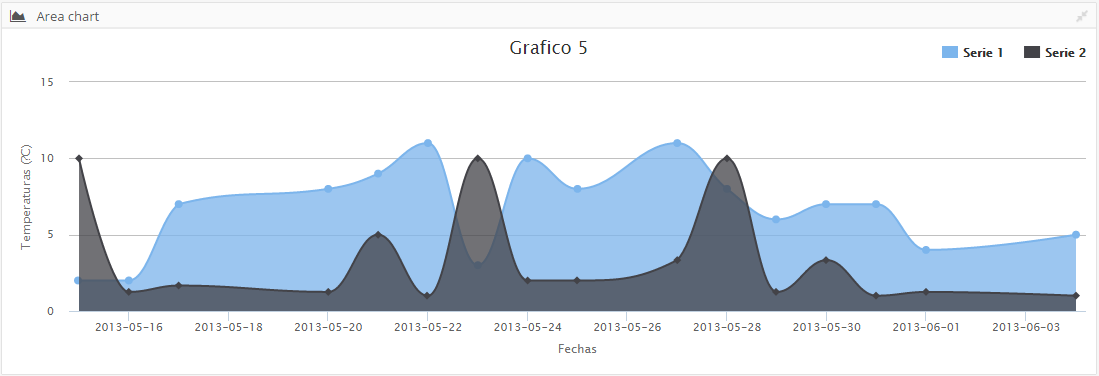
Gráfico de área
- Area chart XML
<window label="SCREEN_TEXT_AREA_CHART" maximize="true" icon="area-chart" style="expand">
  <chart id="ChrAreTst" label="Grafico 5" type="areasplin" initial-load="query" target-action="TstChrTwoSrcLab" max="16">
    <chart-legend align="right" verticalAlign="top" floating="true"/>
    <x-axis label="Fechas" type="datetime">
    <chart-parameter type="object" name="dateTimeLabelFormats">
      <chart-parameter type="string" name="day" value="%Y-%m-%d"/>
    </chart-parameter>
    <y-axis label="Temperaturas (ºC)"/>
    <chart-tooltip suffix=" ºC" number-decimals="3"/>
    <chart-serie id="serie1" x-value="dates" y-value="serie1" label="Serie 1" />
    <chart-serie id="serie2" x-value="dates" y-value="serie2" label="Serie 2" />
  </chart>
</window>
- Query XML
  <!-- GET TWO DATA SERIES WITH A LABEL -->
  <query id="TstChrTwoSrcLab" distinct="true">
    <table id="HISAweDbs"/>
    <field id="HISdat" function="TRUNCDATE" alias="dates" transform="DATE_MS"/>
    <computed format="parseInt(Math.random()*10,10)+2" eval="true" alias="serie1" transform="NUMBER"/>
    <computed format="(1/(parseInt(Math.random()*10,10)+1))*10" eval="true" alias="serie2" transform="NUMBER"/>
    <order-by field="dates" type="ASC"/>
    <where>
      <and>
        <filter field="HISdat" condition=">=" variable="MinDat"/>
      </and>
    </where>
    <variable id="MinDat" type="DATE" value="14/05/2013" />
  </query>
Gráfico de barras
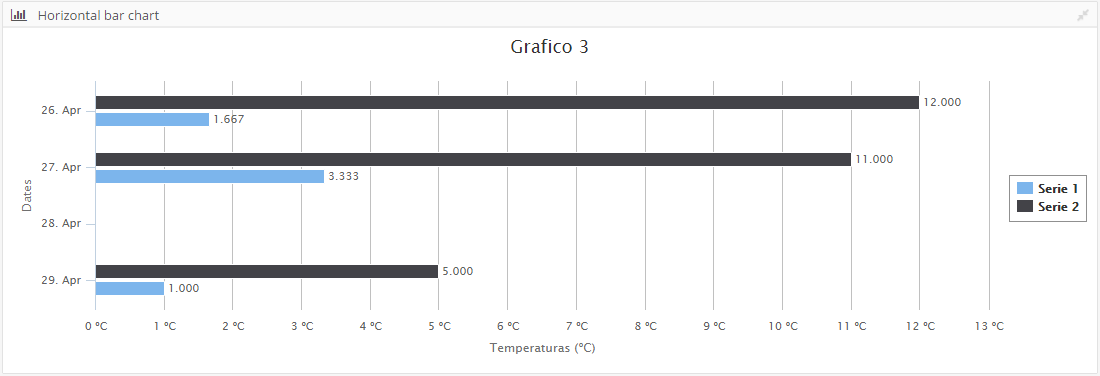
- Bar chart XML
<window label="SCREEN_TEXT_BAR_CHART_HORIZONTAL" maximize="true" icon="bar-chart" style="expand">
  <chart id="ChrBarHorTst" label="Grafico 3" type="column" enable-data-labels="true" format-data-labels="{y:.3f}"    inverted="true" initial-load="query" target-action="TstChrThrDatSrcHor" max="3">
   <chart-legend layout="vertical" align="right" verticalAlign="middle" border-width="1"/>
   <x-axis label="SCREEN_TEXT_CHART_AXIS_DATES" type="datetime" tick-interval="259200"/>
   <y-axis label="Temperaturas (ºC)" tick-interval="1" label-format="{value} ºC"/>
   <chart-tooltip suffix=" ºC" number-decimals="3" date-format="%Y-%m-%d"/>
   <chart-serie id="serie1" x-value="dates" y-value="serie1" label="Serie 1" />
   <chart-serie id="serie2" x-value="dates" y-value="serie2" label="Serie 2" />
  </chart>
- Query XML
  <!-- GET THREE DATA SERIES WITH DATES (horizontal) -->
  <query id="TstChrThrDatSrcHor" distinct="true">
    <table id="HISAweDbs"/>
    <field id="HISdat" transform="DATE_MS" function="TRUNCDATE" alias="dates"/>
    <computed format="(1/(parseInt(Math.random()*10,10)+1))*10" eval="true" alias="serie1" transform="NUMBER"/>
    <computed format="(parseInt(Math.random()*10,10)+1)+2" eval="true" alias="serie2" transform="NUMBER"/>
    <order-by field="dates" type="ASC"/>
  </query>
Donut en 3D
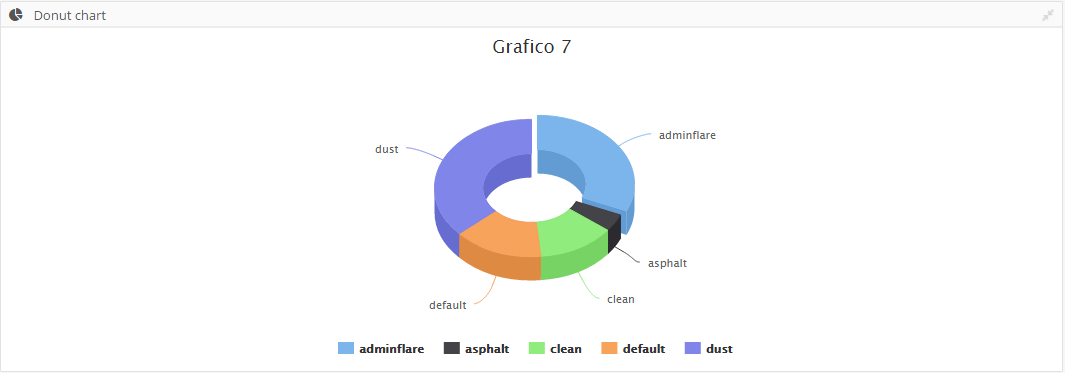
- 3D donut chart XML
<window label="SCREEN_TEXT_DONUT_CHART" icon="pie-chart" maximize="true" style="expand">
  <chart id="ChrDonutTst" label="Grafico 7" type="donut_3d" initial-load="query" target-action="TstChrPieSrc" max="5">
    <chart-legend enabled="true"/>
    <x-axis label="Themes"/>
    <y-axis label="Percent (%)"/>
    <chart-tooltip suffix=" %" number-decimals="2"/>
    <chart-serie id="serie1" x-value="names" y-value="serie1" label="Themes" />
  </chart>
 </window>
- Query XML
 <query id="TstChrPieSrc" distinct="true">
  <table id="AweThm"/>
  <field id="Nam" alias="names"/>
  <computed format="parseInt(Math.random()*100,10)" eval="true" alias="serie1" transform="NUMBER"/>
 </query>
Gráfico 3D de columnas
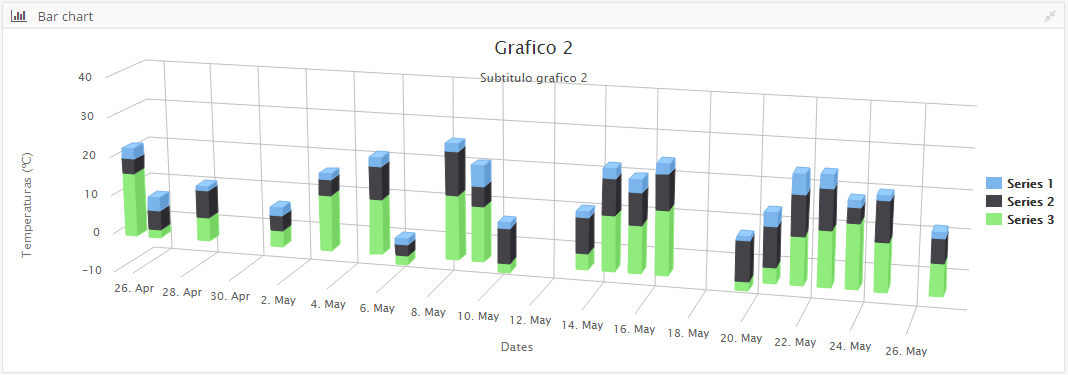
- 3D column chart XML
 <window label="SCREEN_TEXT_BAR_CHART" maximize="true" icon="bar-chart" style="expand">
   <chart id="ChrBarTst" label="Grafico 2" subtitle="Subtitulo grafico 2" type="column_3d" stacking="normal" initial-load="query" target-action="TstChrThrDatSrc" max="21">
     <chart-legend layout="vertical" align="right" verticalAlign="middle" />
     <x-axis label="SCREEN_TEXT_CHART_AXIS_DATES" type="datetime"/>
     <y-axis label="Temperaturas (ºC)"/>
     <chart-tooltip crosshairs="xAxis" suffix=" ºC" number-decimals="3"/>
     <chart-serie id="serie2-1" x-value="dates" y-value="serie1" type="column" label="SCREEN_TEXT_CHART_SERIE_1" />
     <chart-serie id="serie2-2" x-value="dates" y-value="serie2" type="column" label="SCREEN_TEXT_CHART_SERIE_2" />
     <chart-serie id="serie2-3" x-value="dates" y-value="serie3" type="column" label="SCREEN_TEXT_CHART_SERIE_3" />
    </chart>
  </window>
- Query XML
  <!-- GET THREE DATA SERIES WITH DATES -->
  <query id="TstChrThrDatSrc" distinct="true">
    <table id="HISAweDbs"/>
    <field id="HISdat" transform="DATE_MS" function="TRUNCDATE" alias="dates"/>
    <computed format="(1/(parseInt(Math.random()*10,10)+1))*10" eval="true" alias="serie1" transform="NUMBER"/>
    <computed format="(parseInt(Math.random()*10,10)+1)+2" eval="true" alias="serie2" transform="NUMBER"/>
    <computed format="((parseInt(Math.random()*10,10)+1)*2)-4" eval="true" alias="serie3" transform="NUMBER"/>
    <order-by field="dates" type="ASC"/>
  </query>
Gráfico de stock
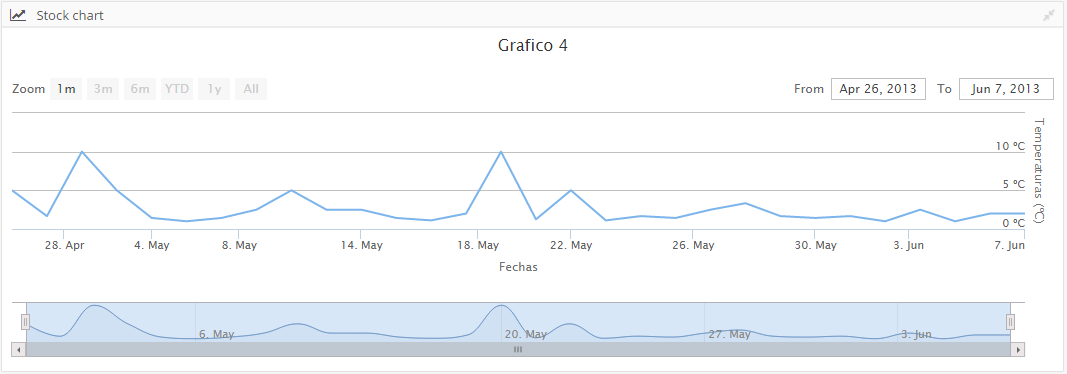
- Stock chart XML
<window label="SCREEN_TEXT_STOCK_CHART" maximize="true" icon="line-chart" style="expand">
   <chart id="ChrStockTst" label="Grafico 4" stock-chart="true" zoom-type="xAxis" type="line" initial-load="query" target-action="TstChrThrDatSrcHor">
     <x-axis label="Fechas" type="datetime"/>
     <y-axis label="Temperaturas (ºC)" label-format="{value} ºC"/>
     <chart-tooltip suffix=" ºC" number-decimals="2"/>
     <chart-serie id="serie1" x-value="dates" y-value="serie1" label="Serie 1" />
   </chart>
 </window>
- Query XML
  <!-- GET THREE DATA SERIES WITH DATES (horizontal) -->
  <query id="TstChrThrDatSrcHor" distinct="true">
    <table id="HISAweDbs"/>
    <field id="HISdat" transform="DATE_MS" function="TRUNCDATE" alias="dates"/>
    <computed format="(1/(parseInt(Math.random()*10,10)+1))*10" eval="true" alias="serie1" transform="NUMBER"/>
    <computed format="(parseInt(Math.random()*10,10)+1)+2" eval="true" alias="serie2" transform="NUMBER"/>
    <order-by field="dates" type="ASC"/>
  </query>
Gráfico con desglose
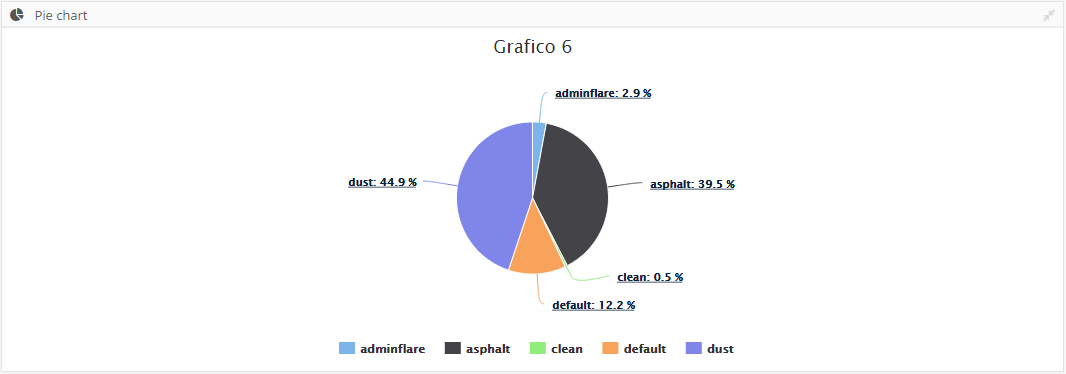
- Drill down chart XML
<window label="SCREEN_TEXT_PIE_CHART" maximize="true" icon="pie-chart" style="expand">
<chart id="ChrPieTst" label="Grafico 6" type="pie" initial-load="query" enable-data-labels="true" format-data-labels="<b>{point.name}</b>: {point.percentage:.1f} %" target-action="TstChrPieDrillSrc" max="5">
<chart-legend enabled="true"/>
<x-axis label="Themes"/>
<y-axis label="Percent (%)"/>
<chart-tooltip suffix=" %" number-decimals="2"/>
<chart-serie id="serie1" x-value="names" y-value="serie1" label="Themes" drilldown-serie="serie1_1"/>
<chart-serie id="serie1_1" drilldown="true" x-value="names" y-value="subserie1" label="SubThemes"/>
</chart>
</window>
- Query XML
  <!-- GET PIE DATA -->
  <query id="TstChrPieDrillSrc" distinct="true">
    <table id="AweThm"/>
    <field id="Nam" alias="names"/>
    <computed format="parseInt(Math.random()*100,10)" eval="true" alias="serie1" transform="NUMBER"/>
    <computed format="(parseInt(Math.random()*100,10))+2" eval="true" alias="subserie1" transform="NUMBER"/>
  </query>
Gráfico de semicírculo
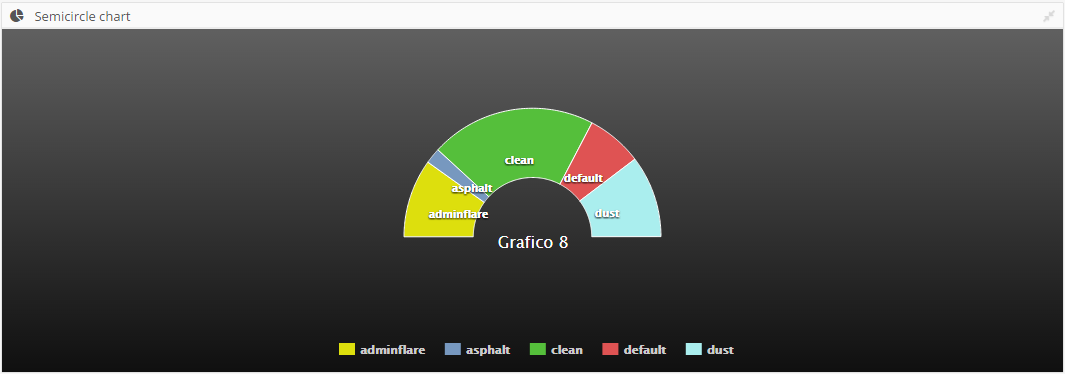
- Semicircle chart XML
<window label="SCREEN_TEXT_SEMICIRCLE_CHART" icon="pie-chart" maximize="true" style="expand">
   <chart id="ChrSemiCircleTst" label="Grafico 8" type="semicircle" theme="gray" enable-data-labels="true" initial-load="query" target-action="TstChrPieSrc" max="5">
     <chart-legend enabled="true"/>
     <x-axis label="Themes"/>
     <y-axis label="Percent (%)"/>
     <chart-tooltip suffix=" %" number-decimals="2"/>
     <chart-serie id="serie1" x-value="names" y-value="serie1" label="Themes" />
     <chart-parameter type="object" name="title">
       <chart-parameter type="string" name="align" value="center"/>
       <chart-parameter type="string" name="verticalAlign" value="middle"/>
       <chart-parameter type="integer" name="y" value="50"/>
     </chart-parameter>
     <chart-parameter type="object" name="plotOptions">
       <chart-parameter type="object" name="pie">
       <chart-parameter type="object" name="dataLabels">
          <chart-parameter type="boolean" name="enabled" value="true"/>
          <chart-parameter type="integer" name="distance" value="-50"/>
          <chart-parameter type="object" name="style">
            <chart-parameter type="string" name="fontWeight" value="bold"/>
            <chart-parameter type="string" name="color" value="white"/>
            <chart-parameter type="string" name="textShadow" value="0px 1px 2px black"/>
          </chart-parameter>
        </chart-parameter>
       </chart-parameter>
      </chart-parameter>
    </chart>
 </window>
- Query XML
  <query id="TstChrPieSrc" distinct="true">
    <table id="AweThm"/>
    <field id="Nam" alias="names"/>
    <computed format="parseInt(Math.random()*100,10)" eval="true" alias="serie1" transform="NUMBER"/>
  </query>
Temas del gráfico
El motor de gráficos AWE y la biblioteca Highcharts permiten cambiar de estilo fácilmente.
Hay algunos temas por defecto. Just to have setting the attribute theme in chart element with the name of theme.
La lista de temas disponible es:
- dark-unica
- dark-green
- dark-blue
- gray
- grid
Creando tu propio tema
Aquí hay un ejemplo simple para mostrar el proceso:
/**
 * Dark theme for Highcharts JS
 */

Highcharts.theme["your-theme"] = {
colors: ['#058DC7', '#50B432', '#ED561B', '#DDDF00', '#24CBE5', '#64E572',
             '#FF9655', '#FFF263', '#6AF9C4'],
    chart: {
        backgroundColor: {
            linearGradient: [0, 0, 500, 500],
            stops: [
                [0, 'rgb(255, 255, 255)'],
                [1, 'rgb(240, 240, 255)']
            ]
        },
    },
    title: {
        style: {
            color: '#000',
            font: 'bold 16px "Trebuchet MS", Verdana, sans-serif'
        }
    },
    subtitle: {
        style: {
            color: '#666666',
            font: 'bold 12px "Trebuchet MS", Verdana, sans-serif'
        }
    },

    legend: {
        itemStyle: {
            font: '9pt Trebuchet MS, Verdana, sans-serif',
            color: 'black'
        },
        itemHoverStyle:{
            color: 'gray'
        }
    }
};
Note: You must add the new file name into scripts.xml file on your project.
Conceptos avanzados del gráfico
En esta sección explica conceptos avanzados sobre el motor de gráficos AWE:
Sobrescribir atributos de carta alta
El widget de gráficas de Highcharts se basa en lenguaje JSON With <chart-parameter> element, you can add and overwrite highchart api attributes to change the behaviour of chart.
Note: Highchart API is available here
- Example: Change format of labels in xAxis:
  <x-axis label="Fechas" type="datetime">
    <chart-parameter type="object" name="dateTimeLabelFormats">
      <chart-parameter type="string" name="day" value="%Y-%m-%d"/>
    </chart-parameter>
  </x-axis>
- Example: Change title position in a chart:
   <chart-parameter type="object" name="title">
     <chart-parameter type="string" name="align" value="center"/>
     <chart-parameter type="string" name="verticalAlign" value="middle"/>
     <chart-parameter type="integer" name="y" value="50"/>
   </chart-parameter>
- Example: Change plot options to modify the style of chart:
<chart-parameter type="object" name="plotOptions">
    <chart-parameter type="object" name="pie">
       <chart-parameter type="object" name="dataLabels">
         <chart-parameter type="boolean" name="enabled" value="true"/>
         <chart-parameter type="integer" name="distance" value="-50"/>
         <chart-parameter type="object" name="style">
          <chart-parameter type="string" name="fontWeight" value="bold"/>
          <chart-parameter type="string" name="color" value="white"/>
          <chart-parameter type="string" name="textShadow" value="0px 1px 2px black"/>
          </chart-parameter>
        </chart-parameter>
     </chart-parameter>
  </chart-parameter>
Servicio de exportación de gráficas
Highcharts tiene un servidor de exportación que le permite generar gráficas de alta calidad en el servidor:
https://www.highcharts.com/docs/export-module/setting-up-the-server
We have developed a new render service which allows you to generate charts in SVG format using this export server and
AWE charts.
Definiendo gráficos
Definir un gráfico que se generará en el servidor es similar a definir un gráfico que se mostrará en un navegador.
Usted define una pantalla y dentro del gráfico, como se muestra antes. Esta pantalla puede estar o no en la aplicación, no importa.
The charts defined for server generation doesn't need server-action and target-action attributes, as
data sources are going to be passed as parameters.
Uso
There is a new service designed to generate charts in server side, called ChartService.
Este servicio tiene dos métodos que permiten al desarrollador generar cartas usando una sola fuente de datos o múltiples fuentes de datos:
Render a chart with a single DataList
Render chart method (with a single DataList) generates a chart using only one
DataList as datasource.
public String renderChart(String screenName, String chartName, DataList data) throws AWException
screenNameis the name of the screen file where chart ischartNameis theidof the chart to be generateddatais the sourceDataList
Este método devolverá un gráfico en formato SVG+XML (o AWException si hay un error).
Render a chart with multiple DataList
Render chart method (with a map of DataList) generates a chart using multiples datalists.
public String renderChart(String screenName, String chartName, Map<String, DataList> datasources) throws AWException
screenNameis the name of the screen file where chart ischartNameis theidof the chart to be generateddatasourcesis a map of String and DataList which will contain all data sources.
Este método devolverá un gráfico en formato SVG+XML (o AWException si hay un error).
One of the data must be called main, and will be the default one, the rest will match a parameter datasource defined
on the serie which should pick the data. For example, this serie would pick the DataList inside the detail map key:
<chart-serie id="data" x-value="name" y-value="value"/>
<chart-serie id="detail" x-value="name" y-value="value">
  <chart-parameter type="string" name="datasource" value="detail"/>
</chart-serie>
el mapa correspondiente para esta serie debe ser:
Map<String, DataList> datasources = new HashMap<>();
datasources.put("main", mainDataList);
datasources.put("detail", detailDataList);
The first serie (data) will pick the data defined on main key
and the second serie (detail) will pick the data defined on detail key
Procesar servidor
You can configure the render server on application.properties file updating the highcharts.server.url property:
################################################
# Chart properties
################################################
highcharts.server.url=http://export.highcharts.com
The default export server is pointing to Highcharts export server: http://export.highcharts.com