Chart formats
The texts that a chart draws (data labels, tooltips and axis labels) are described with format strings: a text with
{...} tags that are replaced by values. The language is the template language of Highcharts 11. The React engine
interprets the subset described in this page in the browser, so a format that only uses that subset gives the same
text with ECharts. Other number specifications (anything but .Nf and ,.Nf) write the raw value: check them when
you move a chart to the React engine.
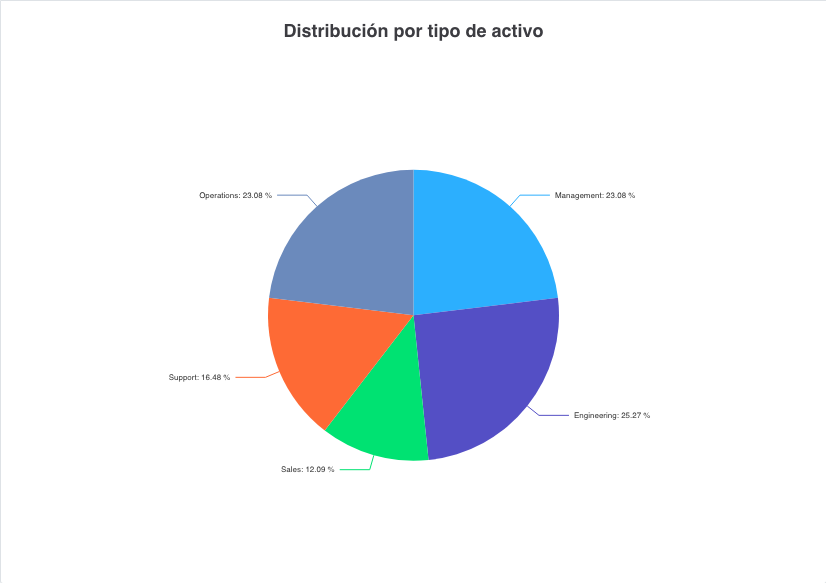
<b>{point.name}</b>: {point.percentage:.1f} %
Where formats are used
| Place | How to set it | Variables |
|---|---|---|
| Data labels | format-data-labels attribute of chart, or dataLabels.format of a series | The point (see below) |
| Axis labels | label-format attribute of x-axis and y-axis, or labels.format | value |
| Tooltip, point line | point-format attribute of chart-tooltip, or the pointFormat parameter | The point |
| Tooltip, header | headerFormat parameter of chart-tooltip | The point |
| Tooltip, footer | footerFormat parameter of chart-tooltip | The point |
| Date of the tooltip | date-format attribute of chart-tooltip | The date of the axis |
A format that is not set uses the default text of the chart: the name of the series and the value in the tooltip, and the value in the axes.
Syntax
Expressions
An expression is a variable between braces, with an optional specification after a colon:
| Expression | Result |
|---|---|
{point.y} | The value as it is received, without rounding |
{point.y:.2f} | The value with two decimals |
{point.y:,.0f} | The value without decimals and with thousands separators |
{point.x:%Y-%m-%d} | The x value (a timestamp) as a date |
{point.name} | The name of the point |
A text between braces that is not a valid expression is kept as text.
Number specifications
.Nf writes the number with N decimals. ,.Nf adds the thousands separator. The decimal point and the separator
come from the language of the application (the decimalPoint and thousandsSep entries of
src/i18n/charts/charts-<language>.json in the React client). Any other number specification writes the value as it is.
Note: The values are never rounded unless the format (or
number-decimalsin the tooltip) asks for it. A value of3.14159265is drawn as3.14159265when there is no specification.
Date specifications
A specification that starts with % formats a timestamp in milliseconds with the local time of the browser:
| Code | Meaning | Code | Meaning |
|---|---|---|---|
%Y | Year (2026) | %H | Hours (00-23) |
%y | Year (26) | %M | Minutes |
%m | Month number (01-12) | %S | Seconds |
%d | Day of the month (01) | %L | Milliseconds |
%e | Day of the month (1) | %b | Short month name |
%B | Month name | %A | Weekday name |
%a | Short weekday name | %% | A percent sign |
The names of the months and of the weekdays come from the language file of the chart texts.
Conditions
{#if <condition>}...{else}...{/if} writes one text or the other. The {else} part is optional.
{#if (gt y 0)}{y:,.0f}€{else}{(multiply y -1):,.0f}€{/if}
Helpers
A tag whose first word is a helper calls it with the rest of the words as arguments. The arguments are numbers, variables or other calls between parentheses:
| Helper | Result |
|---|---|
multiply, divide | Product, quotient |
add, subtract | Sum, difference |
gt, lt, ge, le | >, <, >=, <= |
eq, ne | Equal, not equal |
{multiply value 0.001}k
{(subtract y 10):.1f}
The result of a calculation is rounded to remove floating point noise (0.1 + 0.2 is 0.3).
Variables
For data labels and for the lines of the tooltip, the variables describe the point that is drawn:
| Variable | Content |
|---|---|
point.y, y, value | The value of the point |
point.x, x | The x value (a timestamp in a date axis) |
point.z, z | The z value of a bubble |
point.name, name | The name of the point (the category, or the slice of a pie) |
point.key, key | The name of the point, or its x value when it has no name |
point.percentage, percentage | The percentage of a slice of a pie |
point.color | The color of the point |
series.name | The name of the series |
series.color | The color of the series |
series.userOptions.<name> | An option of the series written as a chart-parameter |
In an inverted chart, x and y keep their AWE meaning: x is the x-value of the series and y its y-value.
The labels of an axis have only the variable value.
Data labels and axis labels
Data labels and axis labels are plain text: the HTML tags of the format are removed and the line breaks become spaces.
<chart id="ChrAdvPie" type="pie" enable-data-labels="true"
format-data-labels="<b>{point.name}</b>: {point.percentage:.2f} %" ...>
Note: The format goes in an XML attribute, so the characters
<,>and&have to be written as<,>and&.
Named formatters
The formatter-function attribute of an axis applies a function by name. There is one:
formatCurrencyMagnitude: writes a number with the symbol of its magnitude.
| Value | Label |
|---|---|
300 | 300 |
1234 | 1.23K |
100000 | 100K |
12000000 | 12M |
<y-axis formatter-function="formatCurrencyMagnitude"/>
Date axes
The labels of a date axis are chosen by the zoom level. Set the date pattern of each unit with the
dateTimeLabelFormats parameter of the axis:
<x-axis type="datetime">
  <chart-parameter type="object" name="dateTimeLabelFormats">
    <chart-parameter type="string" name="month" value="%B %Y"/>
  </chart-parameter>
</x-axis>
Tooltips
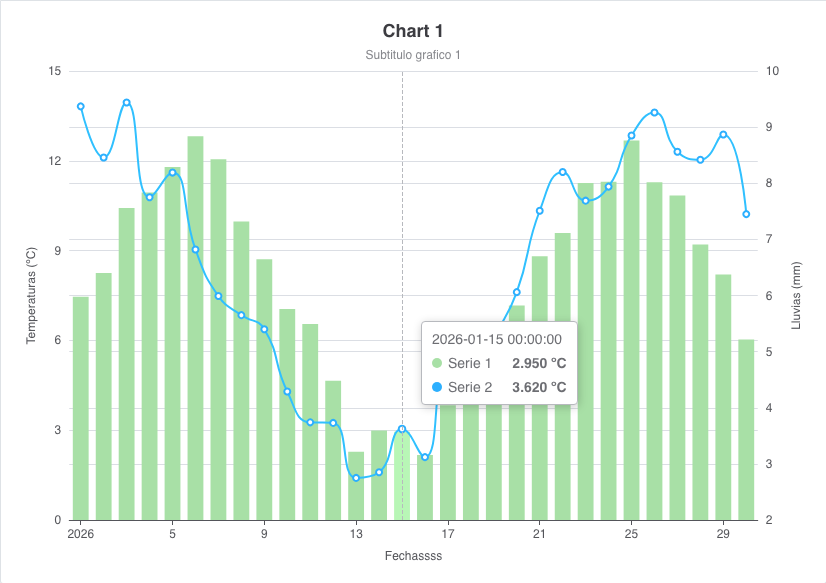
The tooltip of a chart shows a header (once), a line for every point and a footer (once). Without formats, the line is the name of the series and the value, and the header is the value of the axis.
The chart-tooltip attributes give the simple formats:
| Attribute | Effect |
|---|---|
number-decimals | Decimals of the values |
prefix | Text before the value |
suffix | Text after the value |
date-format | Date pattern of the header of a date axis |
shared | One tooltip for all the series at the same x value |
crosshairs | Guide line of the axes |
The suffix of a series (the tooltip.valueSuffix parameter) replaces the one of the tooltip.
HTML tooltips
Use point-format (or the pointFormat, headerFormat and footerFormat parameters) to write your own tooltip. The
tags of the template are kept, even without useHTML, like Highcharts does with its basic HTML (b, i, br and
span). The values that replace the
expressions are escaped, so a value that contains < is shown as text and never becomes markup.
With useHTML set to true the pieces of the tooltip are joined as they are, so a table can be built with the
three formats. When a point format is set, the colored marker of the series is not added before its line, because a
marker outside a table cell would break the table:
<chart-tooltip shared="false">
<chart-parameter type="boolean" name="useHTML" value="true"/>
<chart-parameter type="string" name="headerFormat"
value="<table><tr><th colspan='2'>{point.key}</th></tr>"/>
<chart-parameter type="string" name="pointFormat"
value="<tr><td>{series.userOptions.fullname}: </td><td><b>{#if (gt y 0)}{y:,.0f}€{else}{(multiply y -1):,.0f}€{/if}</b></td></tr>"/>
<chart-parameter type="string" name="footerFormat" value="</table>"/>
</chart-tooltip>
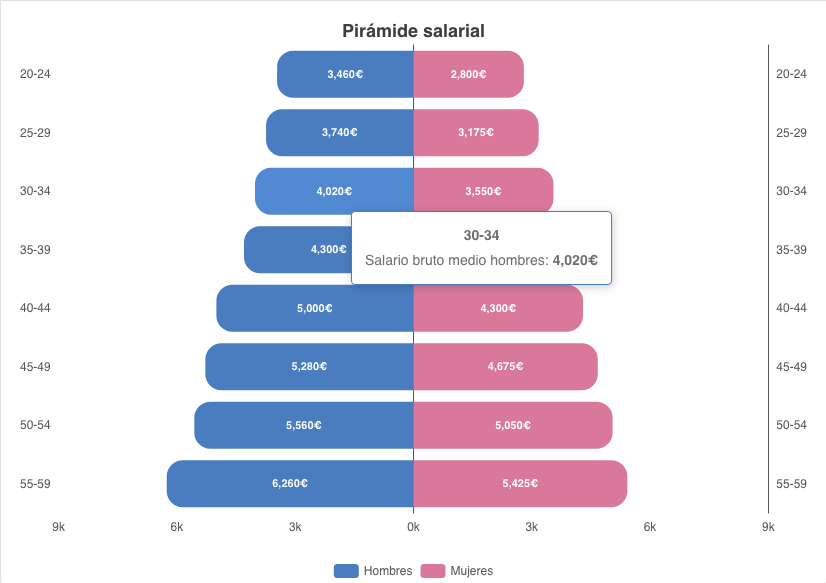
The series of this example hold the text of the line in a custom option, which the format reads as
series.userOptions.fullname:
<chart-serie id="men" type="column" x-value="age" y-value="men" label="Men">
  <chart-parameter type="string" name="fullname" value="Average gross salary of men"/>
</chart-serie>